
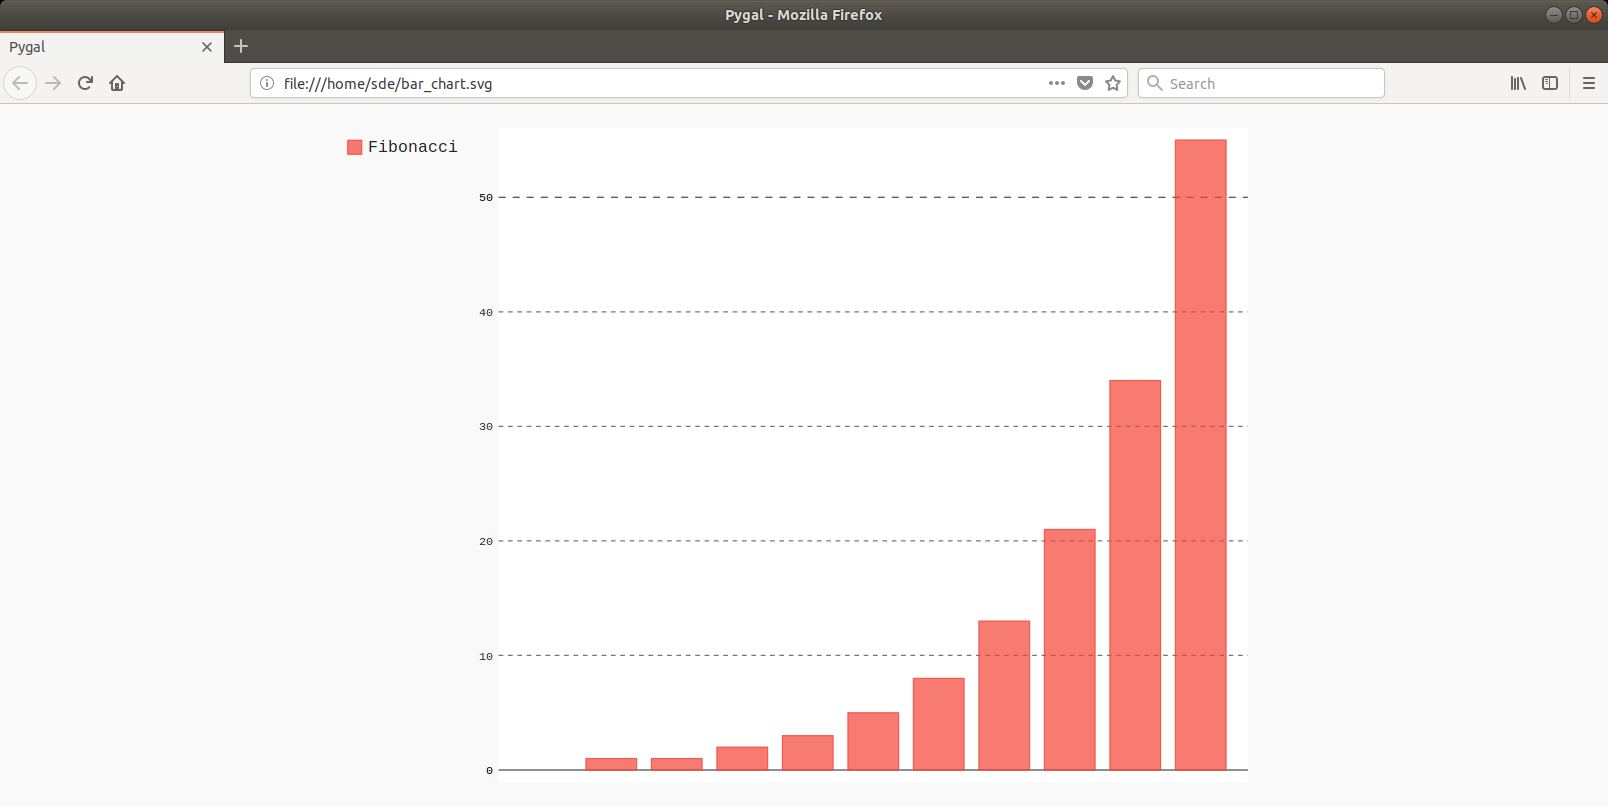
PYthon svg GrAph plotting Library (pygal) is a dynamic SVG charting statistical visualization library written in Python.
Key Features
- Wide range of chart types are supported:
- Line – Basic, horizontal line, stacked, and time.
- Bar – Basic, horizontal, and stacked.
- Histogram – Basic.
- XY – Basic, scatter plot, dates, date, time, and timedelta.
- Pie – Basic, multi-series pie, donut, and half pie.
- Radar – Basic (Kiviat diagram).
- Box – Extremes, interquartile range, tukey, standard deviation, and population standard deviation.
- Dot – Basic (punch card), and a chart supporting negative values.
- Funnel – Basic.
- SolidGauge – Normal and half.
- Gauge – Basic.
- Pyramid – Population pyramid.
- Treemap – Basic.
- Maps – there are three maps available, a world map, a map of France, and a map of Switzerland. For the world map, you can plot countries by specifying their code. With the French map, you can plot administrative divisions and regions. The Swiss map lets you plot cantons, territorial/administrative subdivisions of Switzerland.
- Styles:
- 14 Built-in styles – Default, DarkStyle, Neon, Dark Solarized, Light Solarized, Light, Clean, Red Blue, Dark Colorized, Light Colorized, Turquoise, Light green, Dark green, Dark green blue, and Blue.
- 5 Parametric styles – Rotate, Lighten, Darken, Saturate, and Desaturate.
- Custom styles – 2 different ways using either the Style class, or using a custom css.
- HTML table export of given data.
- Customize series – secondary, stroke, fill, show dots, show only major dots, dots size, stroke style, rounded bars, inner radius, allow interruptions, and formatter.
- Built-in data transformers.
- Export visualizations to PNG/SVG images, stand-alone HTML pages and the Online Vega-Lite Editor.
- Serialize visualizations as JSON files.
- Python API for building statistical visualizations in a declarative way.
- Auto-generated internal Python API that guarantees visualizations are type-checked and in full conformance with the Vega-Lite specification.
- Display visualizations in the live Jupyter Notebook, JupyterLab, nteract, on GitHub and nbviewer.
- Auto-generate Altair Python code from a Vega-Lite JSON spec.
- Public API is chainable and can be simplified as call arguments.
- Available for Python 2.7 and 3.2, 3.3, 3.4, 3.5.
Website: github.com/Kozea/pygal
Support:
Developer: Kozea Group and contributors
License: GNU Lesser General Public License v3.0
pygal is written in Python. Learn Python with our recommended free books and free tutorials.
Related Software
| Python Visualization Packages | |
|---|---|
| matplotlib | Python 2D plotting library which produces publication quality figures |
| Diagrams | Draw the cloud system architecture in Python code |
| Bokeh | Elegant, concise construction of versatile graphics |
| Dash | Python framework for building analytical web applications |
| seaborn | Python visualization library based on matplotlib |
| Plotly | Interactive, browser-based graphing library for Python |
| VisPy | Visualize massive datasets in real time |
| Vega-Altair | Declarative Visualization in Python |
| plotnine | Grammar of graphics for Python |
| PyQtGraph | Python graphics and GUI library built on PyQt4 / PySide and numpy |
| bqplot | Interactive Plotting Framework for the Jupyter Notebook |
| Vaex | Fast visualization of big data |
| PyVista | 3D plotting and mesh analysis |
| folium | Visualize data in a Leaflet map |
| HoloViews | Make Data Analysis and Visualization Seamless |
| Datashader | Generates aggregate arrays and representations of them as images |
| yt | Multi-code Toolkit for Analyzing and Visualizing Volumetric Data |
| Glumpy | Intuitive interface between NumPy and modern OpenGL |
| GeoViews | Explore and visualize geographical, meteorological, and oceanographic datasets |
| Pygal | Dynamic SVG charting library |
| Glue | Multi-dimensional linked-data exploration |
Read our verdict in the software roundup.
 Explore our carefully curated directory of recommended free and open source software, covering every major software category. Explore our carefully curated directory of recommended free and open source software, covering every major software category.The directory forms part of our extensive collection of articles for Linux enthusiasts. It includes hundreds of detailed reviews, together with free and open source alternatives to proprietary software from companies such as Google, Microsoft, Apple, Adobe, IBM, Cisco, Oracle, and Autodesk. LinuxLinks also covers interesting projects worth exploring, Linux-compatible hardware, free programming books and tutorials, and much more. Know a useful free and open source Linux application that we haven’t covered? Tell us about it using our submission form. |
Please read our Comment Policy before commenting.