

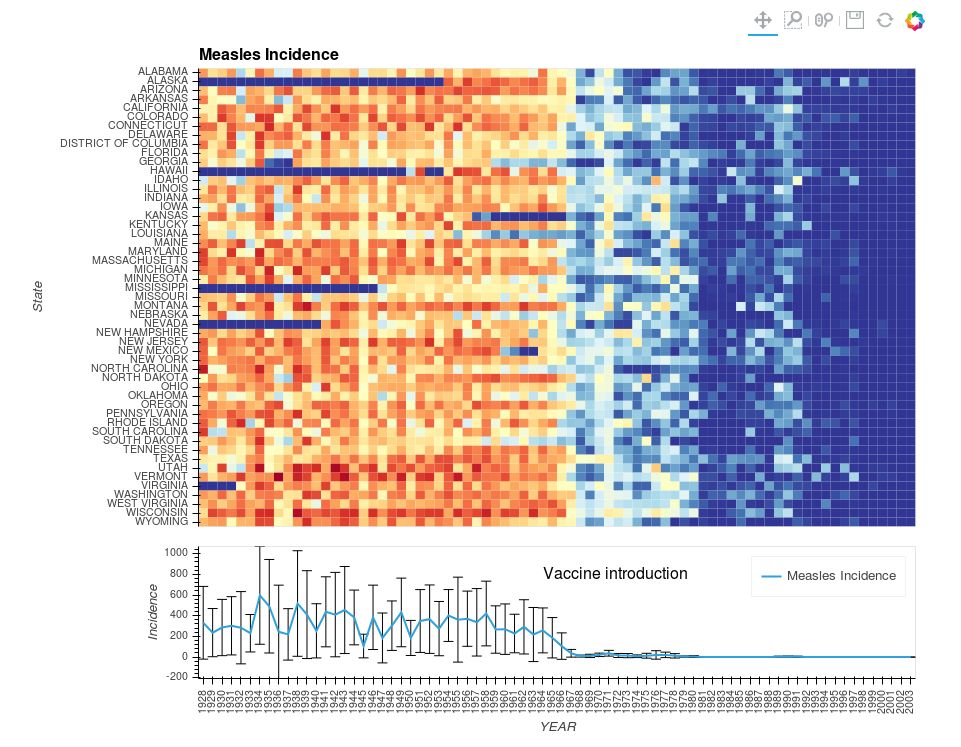
HoloViews is an open-source Python library designed to make data analysis and visualization seamless and simple. With HoloViews, you can usually express what you want to do in very few lines of code, letting you focus on what you are trying to explore and convey, not on the process of plotting.
HoloViews focuses on bundling your data together with the appropriate metadata to support both analysis and visualization, making your raw data and its visualization equally accessible at all times.
HoloViews depends on NumPy and Python 2.7 or 3. It optionally uses the matplotlib, Bokeh, and Plotly backends.
Key Features
- Build data structures that both contain and visualize your data.
- Includes a rich library of composable elements that can be overlaid, nested and positioned easily.
- Supports rapid data exploration that naturally develops into a fully reproducible workflow.
- Create interactive visualizations that can be controlled via widgets or via custom events in Python using the ‘streams’ system. When using the Bokeh backend, you can use streams to directly interact with your plots.
- Rich semantics for indexing and slicing of data in arbitrarily high-dimensional spaces.
- Plotting output using the Matplotlib, Bokeh, and plotly backends.
- A variety of data interfaces to work with tabular and N-dimensional array data using NumPy, pandas, dask, iris, and xarray.
- Every parameter of every object includes easy-to-access documentation.
- Relies heavily on semantic annotations, i.e., metadata you declare that lets HoloViews interpret what your data represents. With these annotations, HoloViews can perform complex tasks like visualization automatically.
- Three types of annotation can be associated with each element:
- Type – used to declare the sort of data you have, which is required before it can be visualized.
- Dimensions – specify the abstract space in which the data resides, allowing axis labeling and indexing.
- Group/Label – declare a meaningful category and human-readable description of the element, allowing plot labeling and selecting related sets of elements.
- Visual options and styling.
- Jupyter Notebook support:
- Support for all recent releases of IPython and Jupyter Notebooks.
- Automatic tab-completion everywhere.
- Exportable sliders and scrubber widgets.
- Custom interactivity using streams and notebook comms to dynamically updating plots.
- Automatic display of animated formats in the notebook or for export, including gif, webm, and mp4.
- Useful IPython magics for configuring global display options and for customizing objects.
- Automatic archival and export of notebooks, including extracting figures as SVG, generating a static HTML copy of your results for reference, and storing your optional metadata like version control information.
- All features available in vanilla Python 2 or 3, with few dependencies.
Website: holoviews.org
Support: User Guide, GitHub Code Repository
Developer: Anaconda
License: BSD 3-Clause “New” or “Revised” License
HoloViews is written in Python. Learn Python with our recommended free books and free tutorials.
Related Software
| Python Data Analysis | |
|---|---|
| pandas | High-level building block for doing practical, real world data analysis |
| NumPy | Core package for scientific computing with Python |
| SciPy | Ecosystem for mathematics, science, and engineering |
| Polars | DataFrame interface on top of an OLAP Query Engine |
| statsmodels | Statistical modeling and econometrics in Python |
| Dask | Advanced parallelism for analytics |
| Orange | Component-based framework for machine learning and data mining |
| Modin | Drop-in replacement for pandas |
| Vaex | Fast visualization of big data |
| AWS DW | Extends the power of pandas library |
| yt | Multi-code Toolkit for Analyzing and Visualizing Volumetric Data |
| HoloViews | Make Data Analysis and Visualization Seamless |
| datatable | Manipulate 2-dimensional tabular data structures |
| xarray | Work with labelled multi-dimensional arrays and datasets |
| pyjanitor | Extend pandas with readable data-cleaning functions |
| Optimus | Agile Data Preparation Workflows |
Read our verdict in the software roundup.
| Python Visualization Packages | |
|---|---|
| matplotlib | Python 2D plotting library which produces publication quality figures |
| Diagrams | Draw the cloud system architecture in Python code |
| Bokeh | Elegant, concise construction of versatile graphics |
| Dash | Python framework for building analytical web applications |
| seaborn | Python visualization library based on matplotlib |
| Plotly | Interactive, browser-based graphing library for Python |
| VisPy | Visualize massive datasets in real time |
| Vega-Altair | Declarative Visualization in Python |
| plotnine | Grammar of graphics for Python |
| PyQtGraph | Python graphics and GUI library built on PyQt4 / PySide and numpy |
| bqplot | Interactive Plotting Framework for the Jupyter Notebook |
| Vaex | Fast visualization of big data |
| PyVista | 3D plotting and mesh analysis |
| folium | Visualize data in a Leaflet map |
| HoloViews | Make Data Analysis and Visualization Seamless |
| Datashader | Generates aggregate arrays and representations of them as images |
| yt | Multi-code Toolkit for Analyzing and Visualizing Volumetric Data |
| Glumpy | Intuitive interface between NumPy and modern OpenGL |
| GeoViews | Explore and visualize geographical, meteorological, and oceanographic datasets |
| Pygal | Dynamic SVG charting library |
| Glue | Multi-dimensional linked-data exploration |
Read our verdict in the software roundup.
 Explore our carefully curated directory of recommended free and open source software, covering every major software category. Explore our carefully curated directory of recommended free and open source software, covering every major software category.The directory forms part of our extensive collection of articles for Linux enthusiasts. It includes hundreds of detailed reviews, together with free and open source alternatives to proprietary software from companies such as Google, Microsoft, Apple, Adobe, IBM, Cisco, Oracle, and Autodesk. LinuxLinks also covers interesting projects worth exploring, Linux-compatible hardware, free programming books and tutorials, and much more. Know a useful free and open source Linux application that we haven’t covered? Tell us about it using our submission form. |
Please read our Comment Policy before commenting.