
Vaex is an open source program and Python library to visualize and explore large tabular datasets.
It can calculate statistics such as mean, sum, count, standard deviation etc, on an N-dimensional grid up to a billion (109) objects/rows per second.
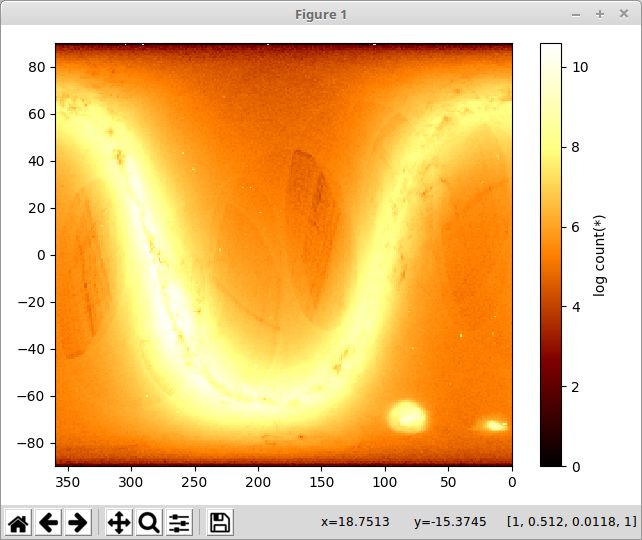
The original motivation to develop Vaex is the Gaia astronomical catalogue containing over a billion stars (at least for data release 1, DR1). Vaex can visualize the complete Gaia catalogue in one second.
Key Features
- Graphical interface for most common uses cases.
- Visualize and explore big tabular data interactively
- Renders histograms, density plots and volume rendering plots for visualization in the order of a billion (109) objects in the order of 1 second.
- Explore the dataset by using visual queries and Boolean expressions to visualize subsets of the data.
- Statistics such as mean, sum, count, standard deviation etc, can all be calculated on an N-dimensional grid.
- For exploration it supports selection in 1 and 2d, but it can also analyze the columns (dimensions) to find subspaces which are richer in information than others.
- Overplot vectors, for instance mean motions, tensors (for instance mean velocity dispersion tensor).
- Custom expressions, e.g. log(sqrt(x**2+y**2)), calculated on the fly.
- Uses memory mapping, zero memory copy policy and lazy computations for best performance. Memory mapped files avoids unnecessary reading and copying of data. Binning or aggregating the data on a grid, using simple optimized algorithms. Columnar storage of data avoids reading unnecessary data and enables maximum performance of hard drives.
- Publish quality output (using matplotlib).
- Linked views: selecting in 1 view will also select it in different views.
- Data formats supported:
- hdf5 (Hierarchical Data Format): gadget, Vaex’s own format;
- hdf5 from Amuse;
- fits bintable;
- VOtable over SAMP;
- gadget native format.
- Client/server architecture: Delegate computations to a remote server.
The Vaex library generates the same plots and more, and offers integration with Jupyter/IPython notebook.
- pip and conda installable.
- Make custom plot and statistics.
- Calculate statistics on a N-dimensional grid and visualize it.
- Create interactive Jupyter/IPython notebooks.
- Publication quality plots with matplotlib.
- Interactive plots with bqplot or Bokeh.
- Combine the notebook with the graphical interface in one kernel.
Website: vaex.io
Support: Documentation, GitHub Code Repository
Developer: Maarten A. Breddels
License: MIT License
Vaex is written in Python. Learn Python with our recommended free books and free tutorials.
Related Software
| Python Data Analysis | |
|---|---|
| pandas | High-level building block for doing practical, real world data analysis |
| NumPy | Core package for scientific computing with Python |
| SciPy | Ecosystem for mathematics, science, and engineering |
| Polars | DataFrame interface on top of an OLAP Query Engine |
| statsmodels | Statistical modeling and econometrics in Python |
| Dask | Advanced parallelism for analytics |
| Orange | Component-based framework for machine learning and data mining |
| Modin | Drop-in replacement for pandas |
| Vaex | Fast visualization of big data |
| AWS DW | Extends the power of pandas library |
| yt | Multi-code Toolkit for Analyzing and Visualizing Volumetric Data |
| HoloViews | Make Data Analysis and Visualization Seamless |
| datatable | Manipulate 2-dimensional tabular data structures |
| xarray | Work with labelled multi-dimensional arrays and datasets |
| pyjanitor | Extend pandas with readable data-cleaning functions |
| Optimus | Agile Data Preparation Workflows |
Read our verdict in the software roundup.
| Python Visualization Packages | |
|---|---|
| matplotlib | Python 2D plotting library which produces publication quality figures |
| Diagrams | Draw the cloud system architecture in Python code |
| Bokeh | Elegant, concise construction of versatile graphics |
| Dash | Python framework for building analytical web applications |
| seaborn | Python visualization library based on matplotlib |
| Plotly | Interactive, browser-based graphing library for Python |
| VisPy | Visualize massive datasets in real time |
| Vega-Altair | Declarative Visualization in Python |
| plotnine | Grammar of graphics for Python |
| PyQtGraph | Python graphics and GUI library built on PyQt4 / PySide and numpy |
| bqplot | Interactive Plotting Framework for the Jupyter Notebook |
| Vaex | Fast visualization of big data |
| PyVista | 3D plotting and mesh analysis |
| folium | Visualize data in a Leaflet map |
| HoloViews | Make Data Analysis and Visualization Seamless |
| Datashader | Generates aggregate arrays and representations of them as images |
| yt | Multi-code Toolkit for Analyzing and Visualizing Volumetric Data |
| Glumpy | Intuitive interface between NumPy and modern OpenGL |
| GeoViews | Explore and visualize geographical, meteorological, and oceanographic datasets |
| Pygal | Dynamic SVG charting library |
| Glue | Multi-dimensional linked-data exploration |
Read our verdict in the software roundup.
 Explore our comprehensive directory of recommended free and open source software. Our carefully curated collection spans every major software category. Explore our comprehensive directory of recommended free and open source software. Our carefully curated collection spans every major software category.This directory is part of our ongoing series of informative articles for Linux enthusiasts. It features hundreds of detailed reviews, along with open source alternatives to proprietary solutions from major corporations such as Google, Microsoft, Apple, Adobe, IBM, Cisco, Oracle, and Autodesk. You’ll also find interesting projects to try, hardware coverage, free programming books and tutorials, and much more. Discovered a useful open source Linux program that we haven’t covered yet? Let us know by completing this form. |