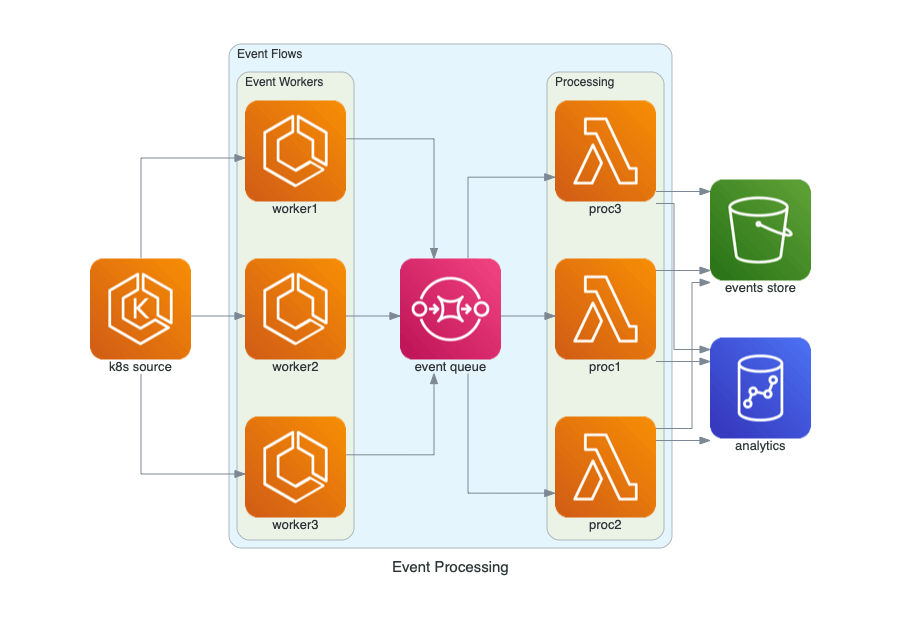
Diagrams lets you draw the cloud system architecture in Python code.
It was born for prototyping a new system architecture without any design tools. You can also describe or visualize the existing system architecture as well.
Diagram as Code allows you to track the architecture diagram changes in any version control system. It uses Graphviz to render the diagram.
Key Features
- Supports main major providers including: AWS, Azure, GCP, Kubernetes, Alibaba Cloud, Oracle Cloud etc.
- Supports On-Premise nodes, SaaS and major Programming frameworks and languages.
- Track the architecture diagram changes in any version control system.
- Cross-platform support – runs under Linux, macOS, and Windows.
Website: diagrams.mingrammer.com
Support: GitHub Code Repository
Developer: MinJae Kwon and many contributors
License: MIT License
Diagrams is written in Python. Learn Python with our recommended free books and free tutorials.
Related Software
| Python Visualization Packages | |
|---|---|
| matplotlib | Python 2D plotting library which produces publication quality figures |
| Diagrams | Draw the cloud system architecture in Python code |
| Bokeh | Elegant, concise construction of versatile graphics |
| Dash | Python framework for building analytical web applications |
| seaborn | Python visualization library based on matplotlib |
| Plotly | Interactive, browser-based graphing library for Python |
| VisPy | Visualize massive datasets in real time |
| Vega-Altair | Declarative Visualization in Python |
| plotnine | Grammar of graphics for Python |
| PyQtGraph | Python graphics and GUI library built on PyQt4 / PySide and numpy |
| bqplot | Interactive Plotting Framework for the Jupyter Notebook |
| Vaex | Fast visualization of big data |
| PyVista | 3D plotting and mesh analysis |
| folium | Visualize data in a Leaflet map |
| HoloViews | Make Data Analysis and Visualization Seamless |
| Datashader | Generates aggregate arrays and representations of them as images |
| yt | Multi-code Toolkit for Analyzing and Visualizing Volumetric Data |
| Glumpy | Intuitive interface between NumPy and modern OpenGL |
| GeoViews | Explore and visualize geographical, meteorological, and oceanographic datasets |
| Pygal | Dynamic SVG charting library |
| Glue | Multi-dimensional linked-data exploration |
Read our verdict in the software roundup.
 Explore our comprehensive directory of recommended free and open source software. Our carefully curated collection spans every major software category. Explore our comprehensive directory of recommended free and open source software. Our carefully curated collection spans every major software category.This directory is part of our ongoing series of informative articles for Linux enthusiasts. It features hundreds of detailed reviews, along with open source alternatives to proprietary solutions from major corporations such as Google, Microsoft, Apple, Adobe, IBM, Cisco, Oracle, and Autodesk. You’ll also find interesting projects to try, hardware coverage, free programming books and tutorials, and much more. Discovered a useful open source Linux program that we haven’t covered yet? Let us know by completing this form. |