
yt is an open-source Python package for analyzing and visualizing volumetric data.
yt focuses on driving physically-meaningful inquiry. The toolkit has been applied in fields such as astrophysics, seismology, radio telescope data, nuclear engineering, molecular dynamics, and oceanography.
yt is written almost entirely in Python and it functions as a library that you can import into your Python scripts.
Key Features
- Supports structured, variable-resolution meshes, unstructured meshes, and discrete or sampled data such as particles.
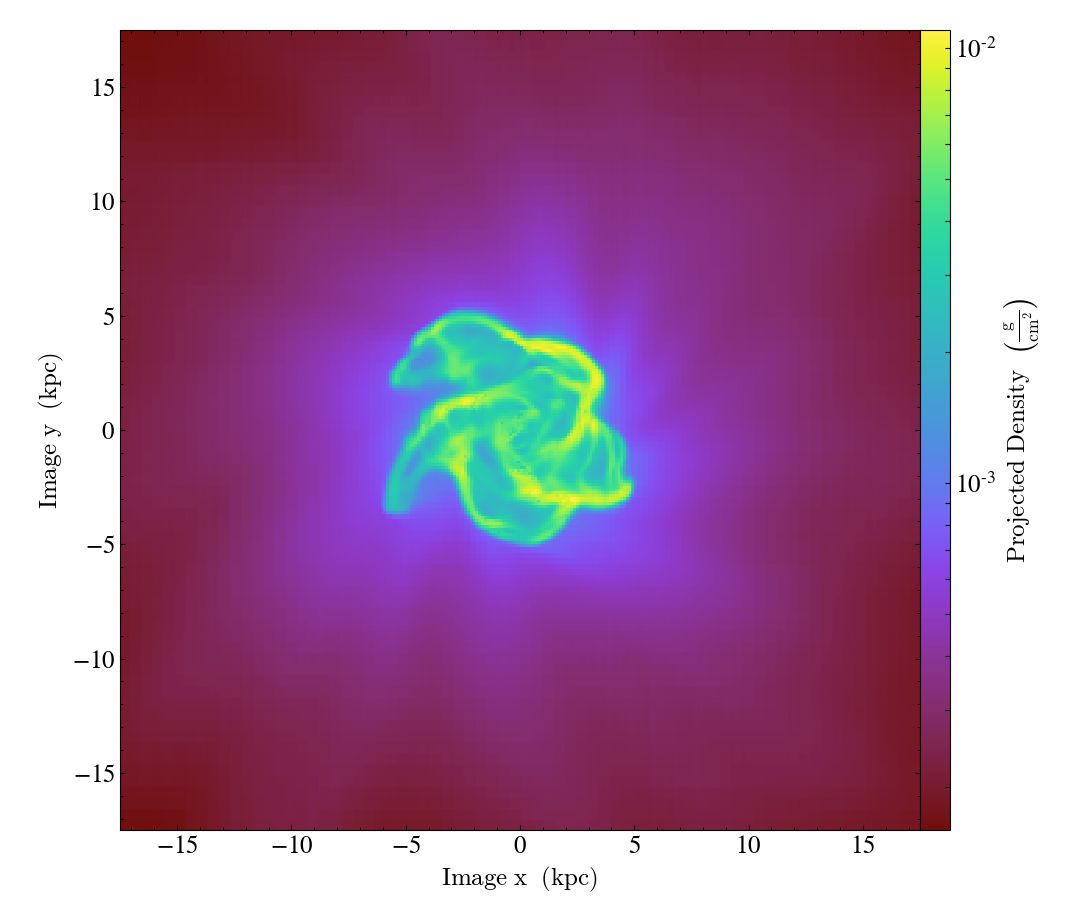
- Create visualizations of simulation data, derived fields, and the data produced by yt analysis objects.
- Overplotting Contours, Velocities, Particles.
- Provides a number of ways of getting the raw data that goes into a plot to you in the form of a one or two dimensional dataset that you can plot using any plotting method you prefer.
- Create 3D visualizations using a process known as volume rendering.
- Volume render unstructured mesh data like that created by finite element calculations.
- Hardware-accelerated interactive volume renderer. This interactive renderer is based on OpenGL and natively understands adaptive mesh refinement data; this enables (GPU) memory-efficient loading of data.
- Implementation of the Marching Cubes algorithm, which can operate on 3D data objects. Surfaces can be exported in OBJ format, values can be samples at the center of each face of the surface, and flux of a given field could be calculated over the surface.
- Mapserver – a Google-Maps-like interface to your data.
- Several colormaps are available including all of the matplotlib colormaps.
- Supports many different code formats including ART, ARTIO, Athena, Castro, Chombo, Enzo, FITS, FLASH, Gadget, GAMER, Gasoline, Gizmo, Grid Data Format, Maestro, MOAB, Nyx, openPMD, Orion, OWLS/EAGLE, Piernik, Pluto, RAMSES, Tipsy, and WarpX.
There’s an all-in-one installation script that downloads and builds a fully-isolated installation of Python that includes NumPy, Matplotlib, H5py, git, and yt.
Website: yt-project.org
Support: Documentation, Mailing List, GitHub
Developer: yt Development Team
License: Modified BSD License (also known as New or Revised BSD)
yt is written in Python. Learn Python with our recommended free books and free tutorials.
Related Software
| Python Data Analysis | |
|---|---|
| pandas | High-level building block for doing practical, real world data analysis |
| NumPy | Core package for scientific computing with Python |
| SciPy | Ecosystem for mathematics, science, and engineering |
| Polars | DataFrame interface on top of an OLAP Query Engine |
| statsmodels | Statistical modeling and econometrics in Python |
| Dask | Advanced parallelism for analytics |
| Orange | Component-based framework for machine learning and data mining |
| Modin | Drop-in replacement for pandas |
| Vaex | Fast visualization of big data |
| AWS DW | Extends the power of pandas library |
| yt | Multi-code Toolkit for Analyzing and Visualizing Volumetric Data |
| HoloViews | Make Data Analysis and Visualization Seamless |
| datatable | Manipulate 2-dimensional tabular data structures |
| xarray | Work with labelled multi-dimensional arrays and datasets |
| pyjanitor | Extend pandas with readable data-cleaning functions |
| Optimus | Agile Data Preparation Workflows |
Read our verdict in the software roundup.
| Python Visualization Packages | |
|---|---|
| matplotlib | Python 2D plotting library which produces publication quality figures |
| Diagrams | Draw the cloud system architecture in Python code |
| Bokeh | Elegant, concise construction of versatile graphics |
| Dash | Python framework for building analytical web applications |
| seaborn | Python visualization library based on matplotlib |
| Plotly | Interactive, browser-based graphing library for Python |
| VisPy | Visualize massive datasets in real time |
| Vega-Altair | Declarative Visualization in Python |
| plotnine | Grammar of graphics for Python |
| PyQtGraph | Python graphics and GUI library built on PyQt4 / PySide and numpy |
| bqplot | Interactive Plotting Framework for the Jupyter Notebook |
| Vaex | Fast visualization of big data |
| PyVista | 3D plotting and mesh analysis |
| folium | Visualize data in a Leaflet map |
| HoloViews | Make Data Analysis and Visualization Seamless |
| Datashader | Generates aggregate arrays and representations of them as images |
| yt | Multi-code Toolkit for Analyzing and Visualizing Volumetric Data |
| Glumpy | Intuitive interface between NumPy and modern OpenGL |
| GeoViews | Explore and visualize geographical, meteorological, and oceanographic datasets |
| Pygal | Dynamic SVG charting library |
| Glue | Multi-dimensional linked-data exploration |
Read our verdict in the software roundup.
 Explore our comprehensive directory of recommended free and open source software. Our carefully curated collection spans every major software category. Explore our comprehensive directory of recommended free and open source software. Our carefully curated collection spans every major software category.This directory is part of our ongoing series of informative articles for Linux enthusiasts. It features hundreds of detailed reviews, along with open source alternatives to proprietary solutions from major corporations such as Google, Microsoft, Apple, Adobe, IBM, Cisco, Oracle, and Autodesk. You’ll also find interesting projects to try, hardware coverage, free programming books and tutorials, and much more. Discovered a useful open source Linux program that we haven’t covered yet? Let us know by completing this form. |
Please read our Comment Policy before commenting.