

Dash is an application framework for creating interactive analytical interfaces that run in a web browser. It is particularly useful where a conventional website needs to expose data, calculations or visualisations through a set of controls rather than through static reports.
Developers define the visible layout and separately describe how outputs respond to user input. This distinction makes interactive workflows easier to reason about, while leaving room to integrate existing data-processing code. Dash applications can range from focused internal tools to larger multipage portals used by teams and customers.
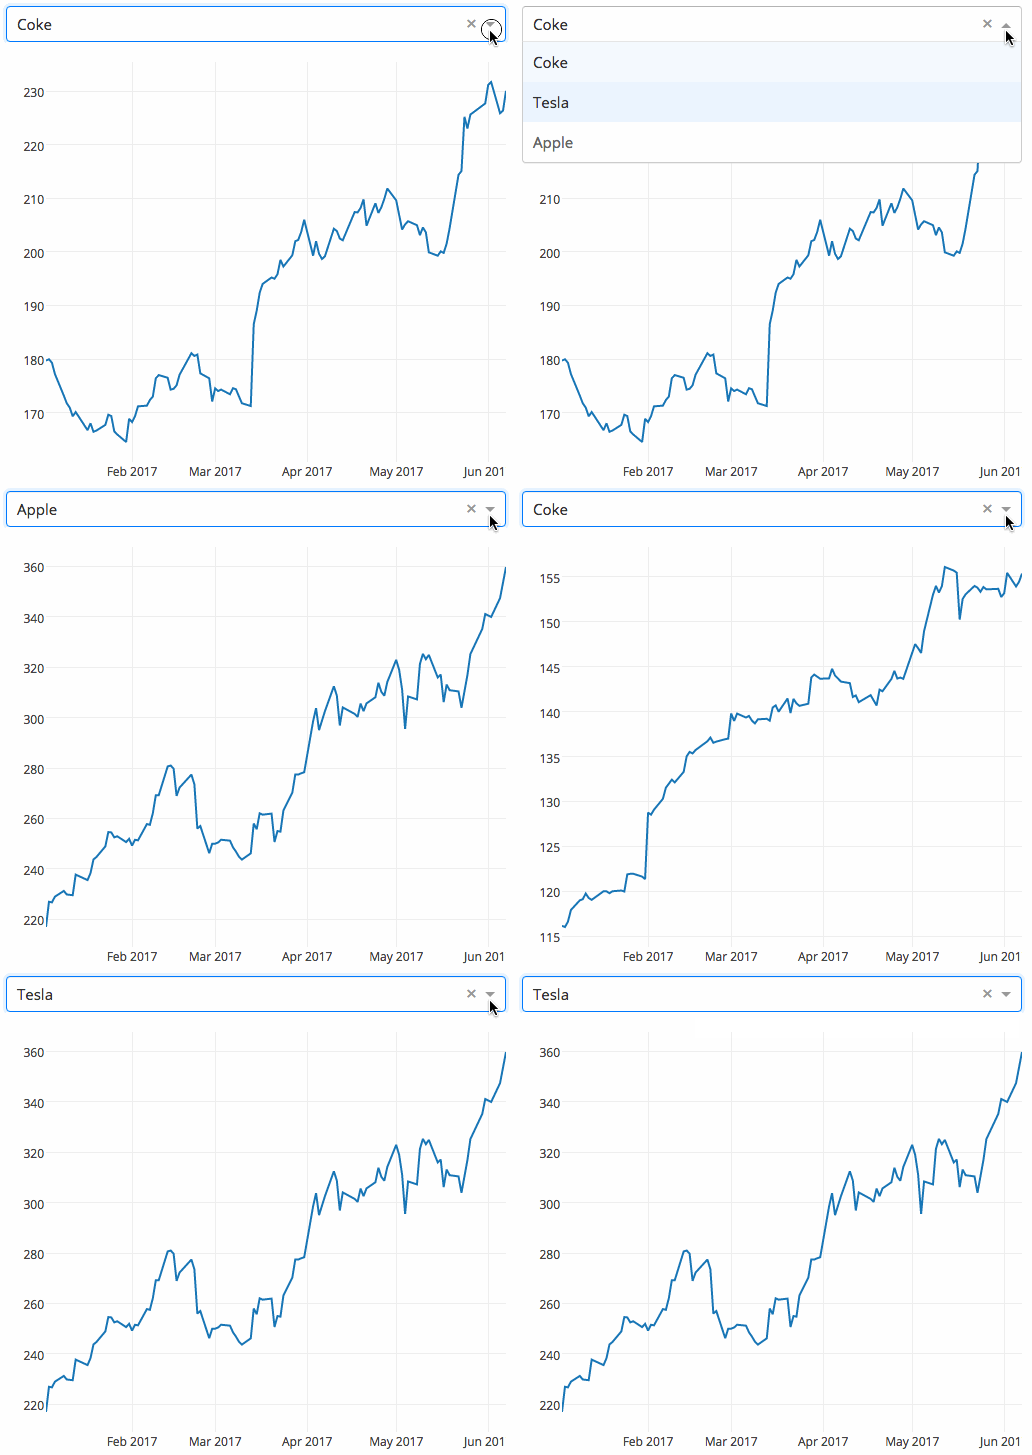
Unlike a general-purpose content framework, Dash makes the relationship between inputs and analytical outputs a first-class development concern. A filter, date selector or selected chart region can drive multiple other elements on the page, making it useful for exploratory reporting and operational monitoring.
This is free and open source software.
Key Features
- Declarative layout built from HTML elements, controls and reusable components.
- Callbacks connect component inputs and state to outputs without manually wiring browser events.
- Interactive Plotly charts support selections, zooming, hovering and filtering.
- Pattern-matching callbacks can respond to dynamically created components.
- Client-side callbacks support interactions that do not need a server round trip.
- Multipage applications use page registration and navigation facilities.
- Background callbacks accommodate tasks that take longer than an ordinary request.
- Data tables and third-party components extend analytical interfaces.
- Server-side endpoints and integration with existing services are available through its underlying web stack.
- Development tools help inspect callbacks and diagnose application behaviour.
- Callback state distinguishes values used by an operation from those that trigger it.
- Component loading states help users understand when analytical updates are pending.
- Persistence options can retain selected control values across sessions or refreshes.
Website: plotly.com/dash
Support:
Developer: Plotly
License: MIT License
Dash is written in Python. Learn Python with our recommended free books and free tutorials.
Related Software
| Python Frameworks | |
|---|---|
| Django | High-level web application framework |
| Dash | Build analytical web applications without JavaScript |
| Tornado | Framework, scalable web server, and asynchronous networking library |
| TurboGears | Framework based on the ObjectDispatch paradigm |
| Masonite | Dev tool with all the features needed for rapid development |
| Robyn | Python web framework designed for high performance |
| Reflex | Library to build full-stack web apps in pure Python |
| Frappe | Low-code, metadata-driven web application framework |
| Zope | Object-oriented web application server |
| Emmett | Full-stack Python web framework |
| PY4WEB | Successor to web2py |
| CubicWeb | Semantic web framework |
| Reahl | Python-only web framework |
| django-hotsauce | Rapid web application development and testing |
| Jam.py | Web front-end application generator |
| Grok | Web framework based on Zope Toolkit technology |
| web2py | Full-featured, full-stack framework for rapid development |
Read our verdict in the software roundup.
| Python Visualization Packages | |
|---|---|
| matplotlib | Python 2D plotting library which produces publication quality figures |
| Diagrams | Draw the cloud system architecture in Python code |
| Bokeh | Elegant, concise construction of versatile graphics |
| Dash | Python framework for building analytical web applications |
| seaborn | Python visualization library based on matplotlib |
| Plotly | Interactive, browser-based graphing library for Python |
| VisPy | Visualize massive datasets in real time |
| Vega-Altair | Declarative Visualization in Python |
| plotnine | Grammar of graphics for Python |
| PyQtGraph | Python graphics and GUI library built on PyQt4 / PySide and numpy |
| bqplot | Interactive Plotting Framework for the Jupyter Notebook |
| Vaex | Fast visualization of big data |
| PyVista | 3D plotting and mesh analysis |
| folium | Visualize data in a Leaflet map |
| HoloViews | Make Data Analysis and Visualization Seamless |
| Datashader | Generates aggregate arrays and representations of them as images |
| yt | Multi-code Toolkit for Analyzing and Visualizing Volumetric Data |
| Glumpy | Intuitive interface between NumPy and modern OpenGL |
| GeoViews | Explore and visualize geographical, meteorological, and oceanographic datasets |
| Pygal | Dynamic SVG charting library |
| Glue | Multi-dimensional linked-data exploration |
Read our verdict in the software roundup.
 LinuxLinks helps you discover the best free and open source software for Linux. Explore our extensive collection of recommended applications, including alternatives to popular proprietary software. We also publish software reviews, Linux tutorials, hardware reviews, free programming books and articles covering the wider open source community. Browse our Linux resources to discover more. Know a useful free and open source Linux application we haven't covered? Suggest a program for inclusion. Has your software been featured on LinuxLinks? Display one of our Featured on LinuxLinks badges on your website or GitHub README. |
Please read our Comment Policy before commenting.