

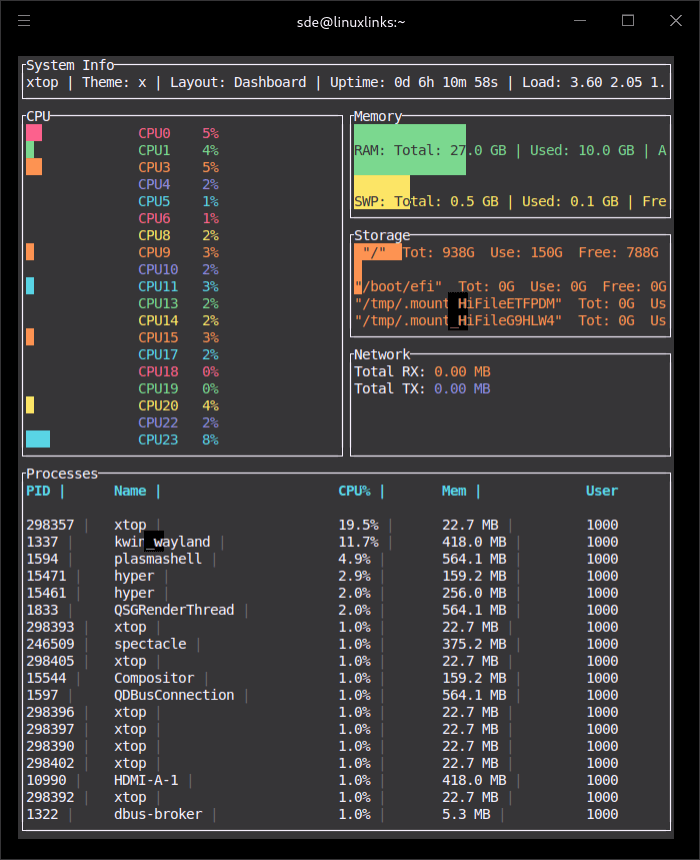
Xtop is a terminal-based system monitor. Inspired by btop, it presents system resource information in a colourful dashboard that can be customised to suit different terminal sizes and monitoring preferences.
The application uses ratatui to draw its interface and sysinfo to obtain operating system statistics. CPU activity, memory consumption and storage information are displayed alongside a list of running processes, providing an overview of how a machine is performing.
Xtop places considerable emphasis on presentation. Its configurable layouts and colour themes let users decide which information deserves the most screen space. This can be helpful on smaller terminal windows or when monitoring a particular resource while carrying out other administrative work.
This is free and open source software.
Key Features
- Displays CPU utilisation by core, with available temperature readings.
- Tracks memory and swap usage using historical graphs.
- Monitors network upload and download traffic by interface, together with storage usage and disk I/O.
- Provides an interactive process list with live searching.
- Includes 13 built-in colour themes and support for custom themes defined using JSONC.
- Offers seven built-in layouts, with custom layout definitions and full-screen views for individual widgets.
- Supports configurable alert thresholds for monitored resources.
- Retains interface preferences through persistent configuration.
Website: github.com/xscriptor/xtop
Support:
Developer: Xscriptor
License: MIT License
Xtop is written in Rust. Learn Rust with our recommended free books and free tutorials.
Related Software
| Process Viewers | |
|---|---|
| btop++ | Continuation of bashtop and BpyTOP rewritten in C++ |
| htop | Provides a full list of processes running |
| Glances | System monitoring tool written in Python |
| nmon | Performance monitoring tool |
| bottom | GUI process/system monitor seeking inspiration from gtop, gotop and htop |
| gtop | System monitoring dashboard for the terminal |
| Conky | Advanced, highly configurable system monitor for X based on torsmo |
| Zenith | Turbo-charged top utility |
| BpyTOP | Presents the system resources in a logical and well-thought out way |
| atop | Monitor for system resources and process activity |
| ttop | System monitoring tool with historical snapshots and alerts |
| below | Time traveling resource monitor |
| sysstat | System performance tools |
| gotop | Seeks inspiration from gtop and vtop |
| sot | System observation tool |
| vtop | System monitoring tool in the spirit of top |
| dgop | System monitoring tool with CLI and REST API |
| evisum | Enlightenment system monitor |
| collectl | Collects data that describes the current system status |
| socktop | Remote system monitor with a rich TUI |
| Saidar | Displays live system statistics |
| Xtop | TUI system monito |
| tiptop | Graphical activity monitor for the command line |
| TTV | Term-task-viewer |
| Lyvoxa Stellar | Built from the ground up in Rust |
| bb | Simple process viewer |
Read our verdict in the software roundup.
 LinuxLinks helps you discover the best free and open source software for Linux. Explore our extensive collection of recommended applications, including alternatives to popular proprietary software. We also publish software reviews, Linux tutorials, hardware reviews, free programming books and articles covering the wider open source community. Browse our Linux resources to discover more. Know a useful free and open source Linux application we haven't covered? Suggest a program for inclusion. Has your software been featured on LinuxLinks? Display one of our Featured on LinuxLinks badges on your website or GitHub README. |
Please read our Comment Policy before commenting.