

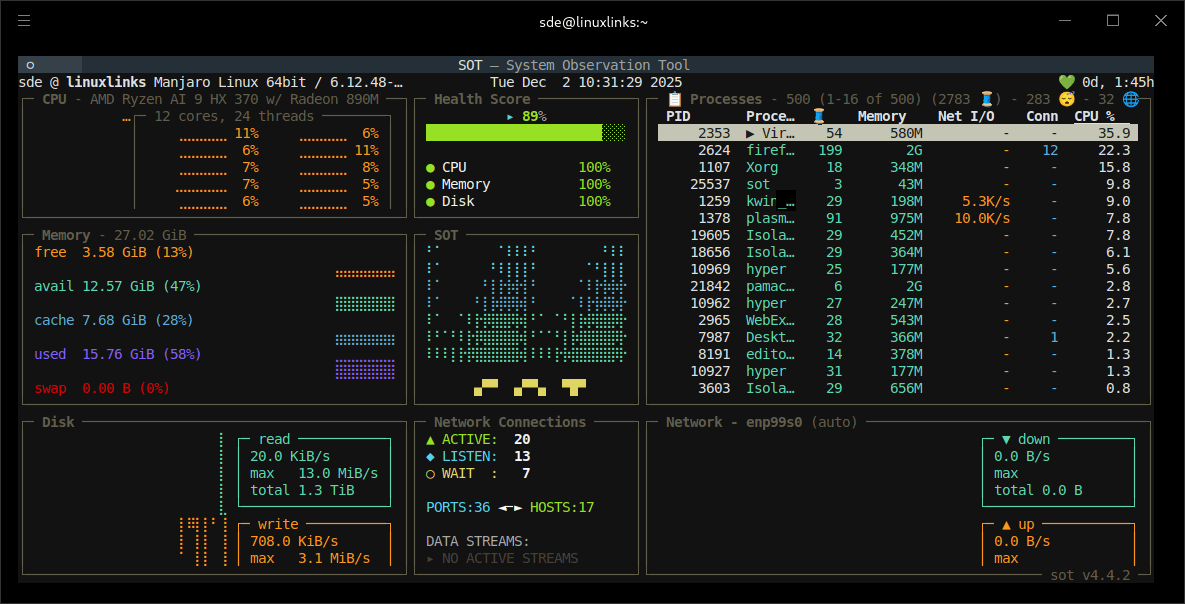
sot is a terminal-based system observation tool that combines resource monitoring, process inspection and several system administration utilities. Its dashboard presents processor, memory, disk and network activity using live statistics and graphs.
Besides the main resource dashboard, sot provides separate commands for examining running processes, inspecting storage devices and benchmarking disk performance. This makes it useful when investigating an unexpectedly busy system or identifying which application is occupying a network port.
This is free and open source software.
Key Features
- Displays CPU usage by core and thread, with interactive process sorting and memory statistics.
- Provides a dedicated process viewer with synchronised panels for running processes, listening network ports and development environments.
- Identifies development servers associated with Node.js, Python, Docker, Ruby, Go and Rust, grouping related processes.
- Offers GPU monitoring with utilisation graphs, memory usage and available temperature and power statistics. Supports NVIDIA and best-effort AMD monitoring on Linux.
- Includes an interactive disk viewer with capacity information, partition details and read/write activity.
- Benchmarks storage performance, including sequential throughput, random IOPS and latency, with optional JSON output.
- Provides system information through the
sot infocommand, together with selectable network interfaces and disks. - Includes a cleanup utility with a dry-run mode for inspecting proposed changes before removing temporary files.
Website: github.com/anistark/sot
Support:
Developer: Kumar Anirudha
License: MIT License
sot is written in Python. Learn Python with our recommended free books and free tutorials.
Related Software
| Process Viewers | |
|---|---|
| btop++ | Continuation of bashtop and BpyTOP rewritten in C++ |
| htop | Provides a full list of processes running |
| Glances | System monitoring tool written in Python |
| nmon | Performance monitoring tool |
| bottom | GUI process/system monitor seeking inspiration from gtop, gotop and htop |
| gtop | System monitoring dashboard for the terminal |
| Conky | Advanced, highly configurable system monitor for X based on torsmo |
| Zenith | Turbo-charged top utility |
| BpyTOP | Presents the system resources in a logical and well-thought out way |
| atop | Monitor for system resources and process activity |
| ttop | System monitoring tool with historical snapshots and alerts |
| below | Time traveling resource monitor |
| sysstat | System performance tools |
| gotop | Seeks inspiration from gtop and vtop |
| sot | System observation tool |
| vtop | System monitoring tool in the spirit of top |
| dgop | System monitoring tool with CLI and REST API |
| evisum | Enlightenment system monitor |
| collectl | Collects data that describes the current system status |
| socktop | Remote system monitor with a rich TUI |
| Saidar | Displays live system statistics |
| Xtop | TUI system monito |
| tiptop | Graphical activity monitor for the command line |
| TTV | Term-task-viewer |
| Lyvoxa Stellar | Built from the ground up in Rust |
| bb | Simple process viewer |
Read our verdict in the software roundup.
 Explore our carefully curated directory of recommended free and open source software, covering every major software category. Explore our carefully curated directory of recommended free and open source software, covering every major software category.The directory forms part of our extensive collection of articles for Linux enthusiasts. It includes hundreds of detailed reviews, together with free and open source alternatives to proprietary software from companies such as Google, Microsoft, Apple, Adobe, IBM, Cisco, Oracle, and Autodesk. LinuxLinks also covers interesting projects worth exploring, Linux-compatible hardware, free programming books and tutorials, and much more. Know a useful free and open source Linux application that we haven’t covered? Tell us about it using our submission form. |
Please read our Comment Policy before commenting.