
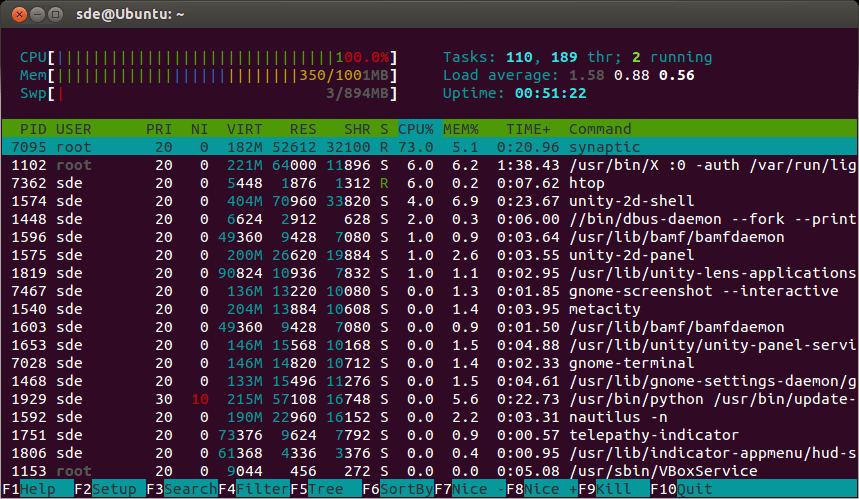
htop is an open source interactive and real time process monitoring application similar to the venerable top utility. With htop, you can scroll the list vertically and horizontally to see all processes and their full command lines.
Tasks related to processes (killing, renicing) can be done without entering their PIDs.
Unlike top, htop provides a full list of processes running, instead of the top resource-consuming processes. htop uses color and gives visual information about processor, swap and memory status.
This application uses the ncurses library.
Key Features
- View processes by user or sort by memory usage, processor usage, and more.
- Color schemes.
- Tree view.
- Uptime, load average meters.
- Scroll the list vertically and horizontally to see all processes and complete command lines.
- Kill a process without typing the process number.
- Renice a process without typing the process number or priority value.
- Support for mouse operation.
- Displays separate processors/processor cores.
- Split CPU meters into two or four columns.
- Support for UTF-8 tree drawing.
- Incremental filtering.
- Support for “steal”/guest CPU time measurement in virtualization environments.
- Integrated lsof.
- Battery meter.
- Linux-VServer support.
- List files used by a process.
- Unicode support.
Website: htop.dev
Support: FAQ
Developer: Hisham Muhammad
License: GNU General Public License v2.0
htop is written in C. Learn C with our recommended free books and free tutorials.
Related Software
| Process Viewers | |
|---|---|
| btop++ | Continuation of bashtop and BpyTOP rewritten in C++ |
| htop | Provides a full list of processes running |
| Glances | System monitoring tool written in Python |
| nmon | Performance monitoring tool |
| bottom | GUI process/system monitor seeking inspiration from gtop, gotop and htop |
| gtop | System monitoring dashboard for the terminal |
| Conky | Advanced, highly configurable system monitor for X based on torsmo |
| Zenith | Turbo-charged top utility |
| BpyTOP | Presents the system resources in a logical and well-thought out way |
| atop | Monitor for system resources and process activity |
| ttop | System monitoring tool with historical snapshots and alerts |
| below | Time traveling resource monitor |
| sysstat | System performance tools |
| gotop | Seeks inspiration from gtop and vtop |
| sot | System observation tool |
| vtop | System monitoring tool in the spirit of top |
| dgop | System monitoring tool with CLI and REST API |
| evisum | Enlightenment system monitor |
| collectl | Collects data that describes the current system status |
| socktop | Remote system monitor with a rich TUI |
| Saidar | Displays live system statistics |
| Xtop | TUI system monito |
| tiptop | Graphical activity monitor for the command line |
| TTV | Term-task-viewer |
| Lyvoxa Stellar | Built from the ground up in Rust |
| bb | Simple process viewer |
Read our verdict in the software roundup.
 Explore our comprehensive directory of recommended free and open source software. Our carefully curated collection spans every major software category. Explore our comprehensive directory of recommended free and open source software. Our carefully curated collection spans every major software category.This directory is part of our ongoing series of informative articles for Linux enthusiasts. It features hundreds of detailed reviews, along with open source alternatives to proprietary solutions from major corporations such as Google, Microsoft, Apple, Adobe, IBM, Cisco, Oracle, and Autodesk. You’ll also find interesting projects to try, hardware coverage, free programming books and tutorials, and much more. Discovered a useful open source Linux program that we haven’t covered yet? Let us know by completing this form. |