

below is an interactive tool to view and record historical system data.
The name “below” stems from the fact that the below developers rejected many of atop’s design and style decisions.
This is free and open source software.
Key Features
- Terminal interface:
- Supports filtering, zooming, pausing, sorting, and scrolling.
- Built in support for persisting/replaying historical data.
- In-depth host-level stats.
- cgroup awareness with cgroup tree view.
below dumpfor scriptable access to historical data.- Goes to great lengths to avoid priority inversions during host resource contention.
- Supports:
- Information regarding hardware resource utilization.
- Viewing the cgroup hierarchy.
- cgroup and process information.
- Pressure stall information (PSI).
- Record mode to record system data.
- Replay mode to replay historical system data.
- Live mode to view live system data.
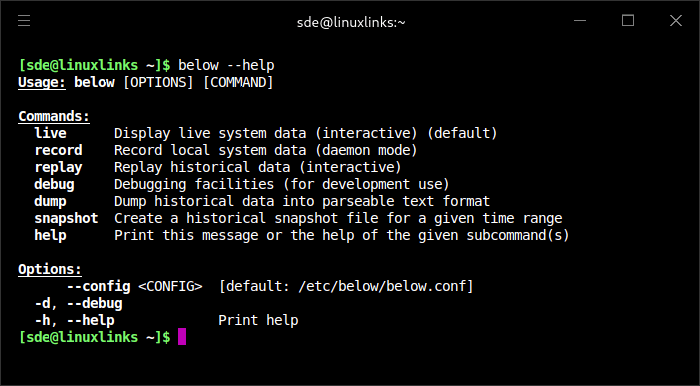
- Dump subcommand to report script-friendly information (eg JSON, CSV, OpenMetrics, etc.).
- Snapshot subcommand to create a replayable snapshot file of historical system data.
- Basic support for Prometheus/Grafana through the dump interface.
Website: github.com/facebookincubator/below
Support:
Developer: Meta Incubator
License: Apache License 2.0
below is written in Rust. Learn Rust with our recommended free books and free tutorials
Related Software
| Process Viewers | |
|---|---|
| btop++ | Continuation of bashtop and BpyTOP rewritten in C++ |
| htop | Provides a full list of processes running |
| Glances | System monitoring tool written in Python |
| nmon | Performance monitoring tool |
| bottom | GUI process/system monitor seeking inspiration from gtop, gotop and htop |
| gtop | System monitoring dashboard for the terminal |
| Conky | Advanced, highly configurable system monitor for X based on torsmo |
| Zenith | Turbo-charged top utility |
| BpyTOP | Presents the system resources in a logical and well-thought out way |
| atop | Monitor for system resources and process activity |
| ttop | System monitoring tool with historical snapshots and alerts |
| below | Time traveling resource monitor |
| sysstat | System performance tools |
| gotop | Seeks inspiration from gtop and vtop |
| sot | System observation tool |
| vtop | System monitoring tool in the spirit of top |
| dgop | System monitoring tool with CLI and REST API |
| evisum | Enlightenment system monitor |
| collectl | Collects data that describes the current system status |
| socktop | Remote system monitor with a rich TUI |
| Saidar | Displays live system statistics |
| Xtop | TUI system monito |
| tiptop | Graphical activity monitor for the command line |
| TTV | Term-task-viewer |
| Lyvoxa Stellar | Built from the ground up in Rust |
| bb | Simple process viewer |
Read our verdict in the software roundup.
 Explore our comprehensive directory of recommended free and open source software. Our carefully curated collection spans every major software category. Explore our comprehensive directory of recommended free and open source software. Our carefully curated collection spans every major software category.This directory is part of our ongoing series of informative articles for Linux enthusiasts. It features hundreds of detailed reviews, along with open source alternatives to proprietary solutions from major corporations such as Google, Microsoft, Apple, Adobe, IBM, Cisco, Oracle, and Autodesk. You’ll also find interesting projects to try, hardware coverage, free programming books and tutorials, and much more. Discovered a useful open source Linux program that we haven’t covered yet? Let us know by completing this form. |
Please read our Comment Policy before commenting.