

amdtop is a terminal-based system monitor for computers powered by AMD hardware.
It combines CPU and general system monitoring with telemetry for AMD discrete GPUs and APUs, as well as supported XDNA NPUs. Its collapsible interface reports CPU activity, temperatures, power consumption, memory use, GPU utilisation, clock speeds, memory bandwidth and per-process resource consumption.
The software is particularly useful for monitoring AMD desktops, workstations and servers equipped with a combination of an AMD processor, Radeon graphics and a Ryzen AI accelerator. It brings information that might otherwise require several utilities together in a single terminal interface.
This is free and open source software.
Installation
I’m running Ubuntu 26.04. The simplest way to install amdtop is with Cargo, Rust’s package manager. amdtop requires Rust 1.88 or later.
$ cargo install amdtop
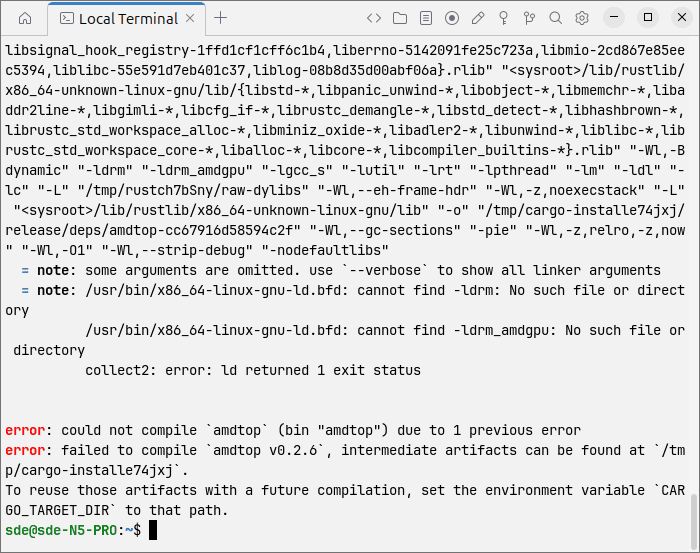
On my test system, the build initially failed because the linker could not find libdrm or libdrm_amdgpu. Their development files are supplied by Ubuntu’s libdrm-dev package:
$ sudo apt install libdrm-dev
I then repeated the installation:
$ cargo install amdtop
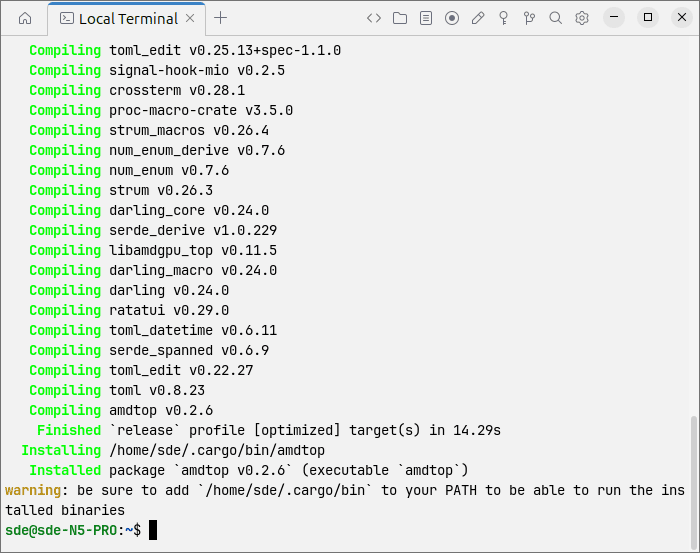
My test system did not have /home/sde/.cargo/bin in its PATH. I added the directory to my shell’s startup file with:
$ echo 'export PATH="$HOME/.cargo/bin:$PATH"' >> ~/.bashrc
$ source ~/.bashrc
In Operation
I’m testing the software on a Minisforum N5 Pro NAS equipped with a Ryzen AI 9 HX PRO 370 processor, integrated Radeon 890M graphics and an XDNA 2 NPU.
In the example below, I’m running ico to generate GPU activity.
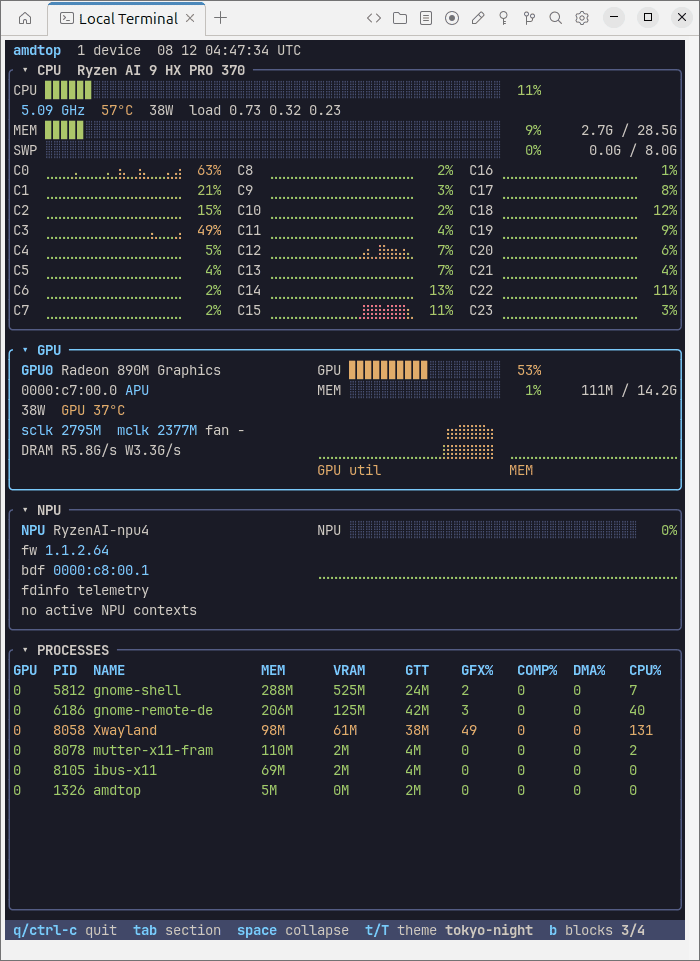
amdtop presents its information in four collapsible sections. The CPU panel shows overall utilisation, clock speed, temperature, power consumption, load averages, memory and swap usage, together with activity graphs for all 24 logical processors.
The GPU panel identifies the Radeon 890M and displays utilisation, memory use, temperature, power draw, clock speeds and DRAM throughput. Small graphs provide a recent history of GPU and memory activity. Below this, the NPU panel reports the Ryzen AI accelerator, firmware version, PCI address and current utilisation.
The processes table attributes resource use to individual applications, listing system memory, VRAM and GTT consumption alongside graphics, compute, DMA and CPU activity. Keyboard shortcuts along the bottom switch between sections, collapse panels, change themes or quit. The selected Tokyo Night theme uses colour effectively while retaining a compact, readable layout.
Key Features
- Collapsible CPU, GPU, NPU and process sections with persistent state.
- Per-core CPU activity graphs, load averages, temperatures, power consumption, memory and swap usage.
- Monitoring of multiple AMD GPUs, with PCI bus identifiers and APU-aware memory reporting.
- GPU utilisation, clock speeds, temperatures, power draw and memory-bandwidth telemetry.
- XDNA NPU detection, with utilisation and per-context telemetry when supported by the driver.
- Per-process system memory, VRAM, GTT and engine activity.
- 41 bundled interface themes that can be changed while amdtop is running.
Summary
amdtop is an impressive system monitor, particularly given the project’s relative youth. It brings detailed CPU, system and Radeon telemetry together in a polished interface that remains easy to navigate despite the volume of information on display. Collapsible sections help users concentrate on the hardware that matters, while the 41 bundled themes provide considerably more visual choice than most terminal monitoring tools.
GPU monitoring is one of amdtop’s strongest areas. Utilisation, memory allocation, clock speeds, temperatures, power consumption and memory throughput are displayed alongside compact history graphs. The process table is also valuable, as it makes it possible to identify which applications are consuming system memory, VRAM and GTT or placing load on individual GPU engines. On a Ryzen AI system, this provides a useful overview without requiring several separate monitoring utilities.
The principal limitation encountered during testing concerned NPU utilisation. FastFlowLM was running on the NPU when the screenshot was taken, but amdtop did not detect any NPU activity. This does not mean that the NPU was idle or malfunctioning: I successfully completed FastFlowLM benchmarks using the accelerator.
amdtop can identify an XDNA device through Linux’s accelerator interface, but displaying its name and firmware information is separate from measuring its workload. Live utilisation requires the loaded amdxdna kernel driver to expose a cumulative drm-engine-* busy-time counter through DRM’s fdinfo interface. amdtop samples changes in that counter over time to calculate utilisation. If the counter is absent, neither the workload nor XRT can provide amdtop with the missing information.
My system was using Ubuntu’s stock 7.0.0-29-generic kernel and its in-tree amdxdna driver. No DKMS replacement was installed. XRT 2.21.75 was present and able to run NPU workloads, but the loaded kernel driver did not expose a usable drm-engine-* counter. There is no amdtop setting or module parameter that can create this telemetry.
The amdtop release tested here uses libamdgpu_top 0.11.5. Its XDNA parser recognises the drm-engine-npu-amdxdna counter exported by AMD’s legacy out-of-tree driver. AMD’s newer staging driver can export a differently named drm-engine-amdxdna_accel_driver counter, but that name is not recognised by the parser used by this amdtop release. Some in-tree drivers expose no engine busy-time counter at all.
Consequently, AMD’s legacy out-of-tree driver currently offers the shortest route to NPU utilisation with the released parser. It should be regarded as a temporary compatibility measure rather than the long-term solution. Support should improve as busy-time accounting reaches distribution kernels and the telemetry parser learns to recognise the counter exported by newer drivers.
I tried replacing Ubuntu’s working in-tree module with AMD’s legacy out-of-tree driver from release 2.21.75, but the replacement driver failed to bind to the NPU. The kernel driver, firmware, XRT and XDNA plugin form a closely matched stack, so replacing only one component can leave the accelerator unusable even when the module compiles successfully. I’ll investigate a matched installation further.
This driver limitation does not detract from amdtop’s CPU and GPU monitoring, which is already practical, detailed and visually accomplished. NPU monitoring remains more dependent on the underlying Linux driver stack and is not yet a plug-and-play feature on stock Ubuntu 26.04. Once the necessary telemetry becomes widely available, amdtop should provide a particularly convenient single-screen overview of an entire AMD system.
Website: github.com/lhl/amdtop
Support:
Developer: Leonard
License: Apache License 2.0
amdtop is written in Rust. Learn Rust with our recommended free books and free tutorials.
Related Software
| Process Viewers | |
|---|---|
| btop++ | Continuation of bashtop and BpyTOP rewritten in C++ |
| htop | Provides a full list of processes running |
| Glances | System monitoring tool written in Python |
| nmon | Performance monitoring tool |
| bottom | GUI process/system monitor seeking inspiration from gtop, gotop and htop |
| gtop | System monitoring dashboard for the terminal |
| Conky | Advanced, highly configurable system monitor for X based on torsmo |
| Zenith | Turbo-charged top utility |
| BpyTOP | Presents the system resources in a logical and well-thought out way |
| atop | Monitor for system resources and process activity |
| ttop | System monitoring tool with historical snapshots and alerts |
| below | Time traveling resource monitor |
| sysstat | System performance tools |
| gotop | Seeks inspiration from gtop and vtop |
| sot | System observation tool |
| vtop | System monitoring tool in the spirit of top |
| dgop | System monitoring tool with CLI and REST API |
| evisum | Enlightenment system monitor |
| collectl | Collects data that describes the current system status |
| socktop | Remote system monitor with a rich TUI |
| Saidar | Displays live system statistics |
| Xtop | TUI system monito |
| tiptop | Graphical activity monitor for the command line |
| TTV | Term-task-viewer |
| Lyvoxa Stellar | Built from the ground up in Rust |
| bb | Simple process viewer |
Read our verdict in the software roundup.
 Explore our carefully curated directory of recommended free and open source software, covering every major software category. Explore our carefully curated directory of recommended free and open source software, covering every major software category.The directory forms part of our extensive collection of articles for Linux enthusiasts. It includes hundreds of detailed reviews, together with free and open source alternatives to proprietary software from companies such as Google, Microsoft, Apple, Adobe, IBM, Cisco, Oracle, and Autodesk. LinuxLinks also covers interesting projects worth exploring, Linux-compatible hardware, free programming books and tutorials, and much more. Know a useful free and open source Linux application that we haven’t covered? Tell us about it using our submission form. |
Please read our Comment Policy before commenting.