
The sysstat utilities are a collection of open source performance monitoring tools for Linux.
The utilities include mpstat, iostat, nfsiostat-sysstat, cifsiostat, pidstat, sar, sadc, sadf and sa tools.
Many programs available on the internet use sysstat’s data to make graphs (one of them, isag, is included in sysstat).
- iostat – reports CPU statistics and input/output statistics for devices, partitions and network filesystems.
- mpstat – reports individual or combined processor related statistics.
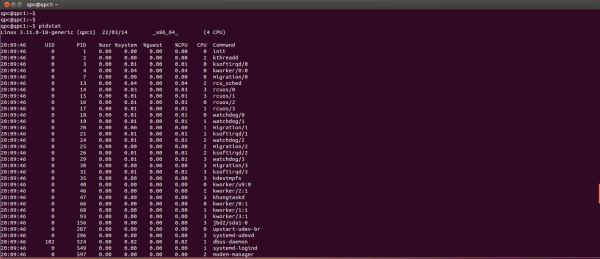
- pidstat – reports statistics for Linux tasks (processes) : I/O, CPU, memory, etc.
- sar – collects, reports and saves system activity information (CPU, memory, disks, interrupts, network interfaces, TTY, kernel tables, etc).
- sadc – is the system activity data collector, used as a backend for sar.
- sa1 – collects and stores binary data in the system activity daily data file. It is a front end to sadc designed to be run from cron.
- sa2 – writes a summarized daily activity report. It is a front end to sar designed to be run from cron.
- sadf – displays data collected by sar in multiple formats (CSV, XML, etc.) This is useful to load performance data into a database, or import them in a spreadsheet to make graphs.
- nfsiostat-sysstat – reports input/output statistics for network filesystems (NFS).
- cifsiostat – reports CIFS statistics.
Key Features
- Monitor:
- Input / Output and transfer rate statistics (global, per device, per partition, per network filesystem and per Linux task / PID).
- CPU statistics (global, per CPU and per Linux task / PID), including support for virtualization architectures.
- Memory, hugepages and swap space utilization statistics.
- Virtual memory, paging and fault statistics.
- Per-task (per-PID) memory and page fault statistics.
- Global CPU and page fault statistics for tasks and all their children.
- Process creation activity.
- Interrupt statistics (global, per CPU and per interrupt, including potential APIC interrupt sources, hardware and software interrupts).
- Extensive network statistics: network interface activity (number of packets and kB received and transmitted per second, etc.) including failures from network devices; network traffic statistics for IP, TCP, ICMP and UDP protocols based on SNMPv2 standards; support for IPv6-related protocols.
- NFS server and client activity.
- Socket statistics.
- Run queue and system load statistics.
- Kernel internal tables utilization statistics.
- System and per Linux task switching activity.
- Swapping statistics.
- TTY device activity.
- Power management statistics (instantaneous and average CPU clock frequency, fans speed, devices temperature, voltage inputs, USB devices plugged into the system)
- Filesystems utilization (inodes and blocks).
- Average statistics values are calculated over the sampling period.
- Most system statistics can be saved in a file for future inspection.
- Allows to configure the length of data history to keep.
- On the fly detection of new devices (disks, network interfaces, etc.) that are created or registered dynamically.
- Support for UP and SMP machines, including machines with hyperthreaded or multi-core processors.
- Support for hotplug CPUs (it detects automagically processors that are disabled or enabled on the fly) and tickless CPUs.
- Works on many different architectures, whether 32- or 64-bit.
- Needs very little CPU time to run (written in C).
- System statistics can be exported in various different formats (CSV, XML, JSON, etc.). DTD and XML Schema documents are included in sysstat package.
- Internationalization support.
Website: github.com/sysstat/sysstat
Support:
Developer: Sebastien Godard
License: GNU General Public License v2.0
sysstat is written in C. Learn C with our recommended free books and free tutorials.
Related Software
| Process Viewers | |
|---|---|
| btop++ | Continuation of bashtop and BpyTOP rewritten in C++ |
| htop | Provides a full list of processes running |
| Glances | System monitoring tool written in Python |
| nmon | Performance monitoring tool |
| bottom | GUI process/system monitor seeking inspiration from gtop, gotop and htop |
| gtop | System monitoring dashboard for the terminal |
| Conky | Advanced, highly configurable system monitor for X based on torsmo |
| Zenith | Turbo-charged top utility |
| BpyTOP | Presents the system resources in a logical and well-thought out way |
| atop | Monitor for system resources and process activity |
| ttop | System monitoring tool with historical snapshots and alerts |
| below | Time traveling resource monitor |
| sysstat | System performance tools |
| gotop | Seeks inspiration from gtop and vtop |
| sot | System observation tool |
| vtop | System monitoring tool in the spirit of top |
| dgop | System monitoring tool with CLI and REST API |
| evisum | Enlightenment system monitor |
| collectl | Collects data that describes the current system status |
| socktop | Remote system monitor with a rich TUI |
| Saidar | Displays live system statistics |
| Xtop | TUI system monito |
| tiptop | Graphical activity monitor for the command line |
| TTV | Term-task-viewer |
| Lyvoxa Stellar | Built from the ground up in Rust |
| bb | Simple process viewer |
Read our verdict in the software roundup.
 Explore our comprehensive directory of recommended free and open source software. Our carefully curated collection spans every major software category. Explore our comprehensive directory of recommended free and open source software. Our carefully curated collection spans every major software category.This directory is part of our ongoing series of informative articles for Linux enthusiasts. It features hundreds of detailed reviews, along with open source alternatives to proprietary solutions from major corporations such as Google, Microsoft, Apple, Adobe, IBM, Cisco, Oracle, and Autodesk. You’ll also find interesting projects to try, hardware coverage, free programming books and tutorials, and much more. Discovered a useful open source Linux program that we haven’t covered yet? Let us know by completing this form. |
Please read our Comment Policy before commenting.