
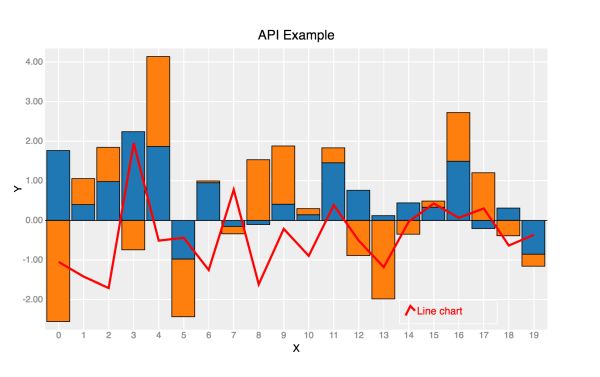
bqplot is a Grammar of Graphics-based interactive open source plotting framework for the Jupyter notebook based on the interactive Jupyter widgets.
It aims to offer a a unified framework for 2-D visualizations with a pythonic API, and a sensible API for adding user interactions (panning, zooming, selection, etc).
In bqplot, every single attribute of the plot is an interactive widget. This allows the user to integrate any plot with IPython widgets to create a complex and feature rich GUI from just a few simple lines of Python code.
bqplot needs ipywidgets, traitlets, traittypes, NumPy, and pandas.
Key Features
- 2 APIs:
- Build custom visualizations using the internal object model, which is inspired by the constructs of the Grammar of Graphics (figure, marks, axes, scales), and enrich their visualization with our Interaction Layer.
- Context-based API similar to Matplotlib’s pyplot, which provides sensible default choices for most parameters.
- Includes routine plots that are familiar to anyone who works in data visualization, as well as interactive selections, candle plots and other novel visualizations.
- Interactivity – every single attribute of the plot is an interactive widget. Create interactive data visualizations. Integrate any plot with IPython widgets to create a complex and feature rich GUI.
Website: github.com/bqplot/bqplot
Support: Documentation, Gitter
Developer: Bloomberg
License: Apache 2.0 license
bqplot is written in TypeScript and Python. Learn TypeScript with our recommended free books and free tutorials. Learn Python with our recommended free books and free tutorials.
Related Software
| Python Visualization Packages | |
|---|---|
| matplotlib | Python 2D plotting library which produces publication quality figures |
| Diagrams | Draw the cloud system architecture in Python code |
| Bokeh | Elegant, concise construction of versatile graphics |
| Dash | Python framework for building analytical web applications |
| seaborn | Python visualization library based on matplotlib |
| Plotly | Interactive, browser-based graphing library for Python |
| VisPy | Visualize massive datasets in real time |
| Vega-Altair | Declarative Visualization in Python |
| plotnine | Grammar of graphics for Python |
| PyQtGraph | Python graphics and GUI library built on PyQt4 / PySide and numpy |
| bqplot | Interactive Plotting Framework for the Jupyter Notebook |
| Vaex | Fast visualization of big data |
| PyVista | 3D plotting and mesh analysis |
| folium | Visualize data in a Leaflet map |
| HoloViews | Make Data Analysis and Visualization Seamless |
| Datashader | Generates aggregate arrays and representations of them as images |
| yt | Multi-code Toolkit for Analyzing and Visualizing Volumetric Data |
| Glumpy | Intuitive interface between NumPy and modern OpenGL |
| GeoViews | Explore and visualize geographical, meteorological, and oceanographic datasets |
| Pygal | Dynamic SVG charting library |
| Glue | Multi-dimensional linked-data exploration |
Read our verdict in the software roundup.
 Explore our carefully curated directory of recommended free and open source software, covering every major software category. Explore our carefully curated directory of recommended free and open source software, covering every major software category.The directory forms part of our extensive collection of articles for Linux enthusiasts. It includes hundreds of detailed reviews, together with free and open source alternatives to proprietary software from companies such as Google, Microsoft, Apple, Adobe, IBM, Cisco, Oracle, and Autodesk. LinuxLinks also covers interesting projects worth exploring, Linux-compatible hardware, free programming books and tutorials, and much more. Know a useful free and open source Linux application that we haven’t covered? Tell us about it using our submission form. |
Please read our Comment Policy before commenting.