
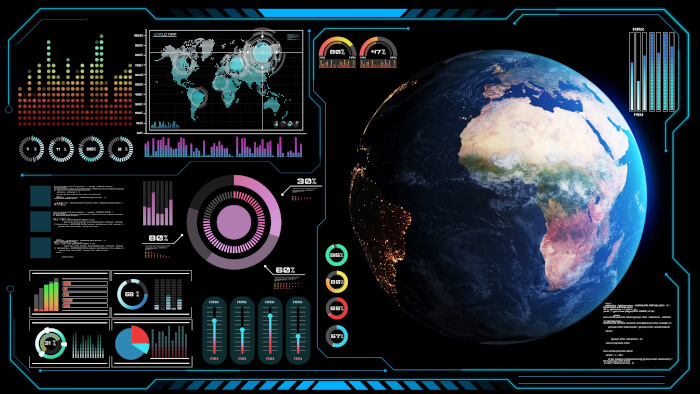
pyecharts is a data visualization library that provides an interface to Apache ECharts, a powerful charting system for producing interactive graphics. It enables developers and data analysts to generate sophisticated visualizations using a concise and configurable API.
The library is suitable for statistical graphics, business reporting, geographic visualization, and interactive data exploration. It combines a wide selection of chart types with extensive customization options, making it possible to create everything from simple charts to elaborate visual presentations.
pyecharts can generate standalone HTML visualizations and integrates with notebook environments and web frameworks. Its method-chaining approach allows charts to be configured through a sequence of readable operations.
This is free and open source software.
Key Features
- Supports more than 30 chart types for displaying numerical, categorical, geographic, and statistical data.
- Creates line, bar, scatter, pie, area, radar, funnel, gauge, and heatmap charts.
- Advanced visualizations include candlestick, Sankey, parallel coordinates, and graph charts.
- Three-dimensional chart types include scatter, bar, surface, and geographic visualizations.
- Interactive features include tooltips, zooming, panning, animations, and data selection.
- Method-chaining API provides a concise approach to chart construction and customization.
- Configurable axes, legends, titles, labels, colours, and visual themes.
- Supports combining multiple chart types within a single visualization.
- Geographic charts include maps and geographic datasets covering countries, regions, and cities.
- Timeline components display changes in data across successive periods.
- Page and Tab components allow multiple charts to be arranged into collections.
- Charts can be rendered as standalone HTML documents for viewing in a browser.
- Image rendering facilities support exporting charts to static graphics.
- Integrates with Jupyter Notebook, JupyterLab, nteract, and marimo.
- Supports integration with Flask and Django web applications.
- JavaScript event handling and extensive chart configuration options allow more advanced interaction.
Website: github.com/pyecharts/pyecharts
Support:
Developer: chenjiandongx and contributors
License: MIT License
pyecharts is written in Python. Learn Python with our recommended free books and free tutorials.
Related Software
| Python Visualization Packages | |
|---|---|
| matplotlib | Python 2D plotting library which produces publication quality figures |
| Diagrams | Draw the cloud system architecture in Python code |
| Bokeh | Elegant, concise construction of versatile graphics |
| Dash | Python framework for building analytical web applications |
| seaborn | Python visualization library based on matplotlib |
| Plotly | Interactive, browser-based graphing library for Python |
| VisPy | Visualize massive datasets in real time |
| Vega-Altair | Declarative Visualization in Python |
| plotnine | Grammar of graphics for Python |
| PyQtGraph | Python graphics and GUI library built on PyQt4 / PySide and numpy |
| bqplot | Interactive Plotting Framework for the Jupyter Notebook |
| Vaex | Fast visualization of big data |
| PyVista | 3D plotting and mesh analysis |
| folium | Visualize data in a Leaflet map |
| HoloViews | Make Data Analysis and Visualization Seamless |
| Datashader | Generates aggregate arrays and representations of them as images |
| yt | Multi-code Toolkit for Analyzing and Visualizing Volumetric Data |
| Glumpy | Intuitive interface between NumPy and modern OpenGL |
| GeoViews | Explore and visualize geographical, meteorological, and oceanographic datasets |
| Pygal | Dynamic SVG charting library |
| Glue | Multi-dimensional linked-data exploration |
Read our verdict in the software roundup.
 LinuxLinks helps you discover the best free and open source software for Linux. Explore our extensive collection of recommended applications, including alternatives to popular proprietary software. We also publish software reviews, Linux tutorials, hardware reviews, free programming books and articles covering the wider open source community. Browse our Linux resources to discover more. Know a useful free and open source Linux application we haven't covered? Suggest a program for inclusion. Has your software been featured on LinuxLinks? Display one of our Featured on LinuxLinks badges on your website or GitHub README. |
Please read our Comment Policy before commenting.