
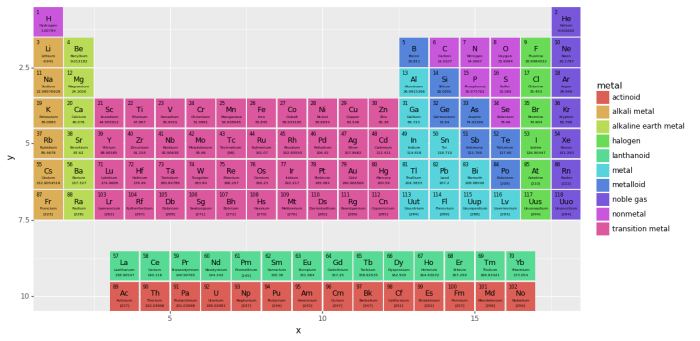
plotnine is a statistical visualisation library based on the grammar of graphics, an approach popularised by ggplot2. It allows users to construct plots by combining data, graphical elements, scales, statistical transformations and presentation settings.
Rather than selecting a chart type and treating it as a fixed object, plotnine encourages plots to be assembled from independent components. A scatter plot can gain a fitted trend line, a statistical summary or another graphical layer without requiring a different plotting interface.
This compositional approach is particularly useful for exploratory analysis, reproducible research and statistical reporting. The library works with structured datasets and provides tools for mapping variables to graphical properties, comparing subsets of observations and controlling the appearance of the resulting figures.
This is free and open source software.
Key Features
- Grammar-of-graphics interface inspired by ggplot2.
- Construct plots by combining data mappings, graphical layers and presentation components.
- Create scatter, line, bar, area, histogram, density and box plots.
- Map dataset variables to position, colour, fill, size, shape and other aesthetics.
- Use statistical transformations for smoothing, binning, aggregation and distribution estimation.
- Apply faceting to divide observations into multiple panels.
- Control continuous, discrete and transformed scales.
- Customise coordinates, including flipped and other supported coordinate systems.
- Combine multiple graphical layers within a single plot.
- Add statistical summaries, fitted trends and reference lines.
- Customise axes, labels, guides and legends.
- Use themes to control typography, backgrounds, grid lines and other visual elements.
- Support common structured data workflows using pandas DataFrames.
- Define reusable plotting components for consistent graphics.
- Export figures to supported image and document formats.
- Use named colour palettes and configurable colour scales.
Website: github.com/has2k1/plotnine
Support:
Developer: Hassan Kibirige
License: GNU General Public License v2.0
plotnine is written in Python. Learn Python with our recommended free books and free tutorials.
Related Software
| Python Visualization Packages | |
|---|---|
| matplotlib | Python 2D plotting library which produces publication quality figures |
| Diagrams | Draw the cloud system architecture in Python code |
| Bokeh | Elegant, concise construction of versatile graphics |
| Dash | Python framework for building analytical web applications |
| seaborn | Python visualization library based on matplotlib |
| Plotly | Interactive, browser-based graphing library for Python |
| VisPy | Visualize massive datasets in real time |
| Vega-Altair | Declarative Visualization in Python |
| plotnine | Grammar of graphics for Python |
| PyQtGraph | Python graphics and GUI library built on PyQt4 / PySide and numpy |
| bqplot | Interactive Plotting Framework for the Jupyter Notebook |
| Vaex | Fast visualization of big data |
| PyVista | 3D plotting and mesh analysis |
| folium | Visualize data in a Leaflet map |
| HoloViews | Make Data Analysis and Visualization Seamless |
| Datashader | Generates aggregate arrays and representations of them as images |
| yt | Multi-code Toolkit for Analyzing and Visualizing Volumetric Data |
| Glumpy | Intuitive interface between NumPy and modern OpenGL |
| GeoViews | Explore and visualize geographical, meteorological, and oceanographic datasets |
| Pygal | Dynamic SVG charting library |
| Glue | Multi-dimensional linked-data exploration |
Read our verdict in the software roundup.
 LinuxLinks helps you discover the best free and open source software for Linux. Explore our extensive collection of recommended applications, including alternatives to popular proprietary software. We also publish software reviews, Linux tutorials, hardware reviews, free programming books and articles covering the wider open source community. Browse our Linux resources to discover more. Know a useful free and open source Linux application we haven't covered? Suggest a program for inclusion. Has your software been featured on LinuxLinks? Display one of our Featured on LinuxLinks badges on your website or GitHub README. |
Please read our Comment Policy before commenting.