Kst is a data plotting and viewing program.
There are two main methods of quickly obtaining plots in Kst. The Kst command-line interface provides quick access to the main Kst features, while the graphical data wizard enables intuitive fine tuning of plot and data settings. Kst can be completely controlled through the graphical user interface, without ever using the command line.
This is free and open source software.
Key Features
- Robust plotting of live “streaming” data.
- Powerful keyboard and mouse plot manipulation.
- Powerful plugins and extensions support. It has simple and standardized interface that facilitates easy creation of additional plugins.
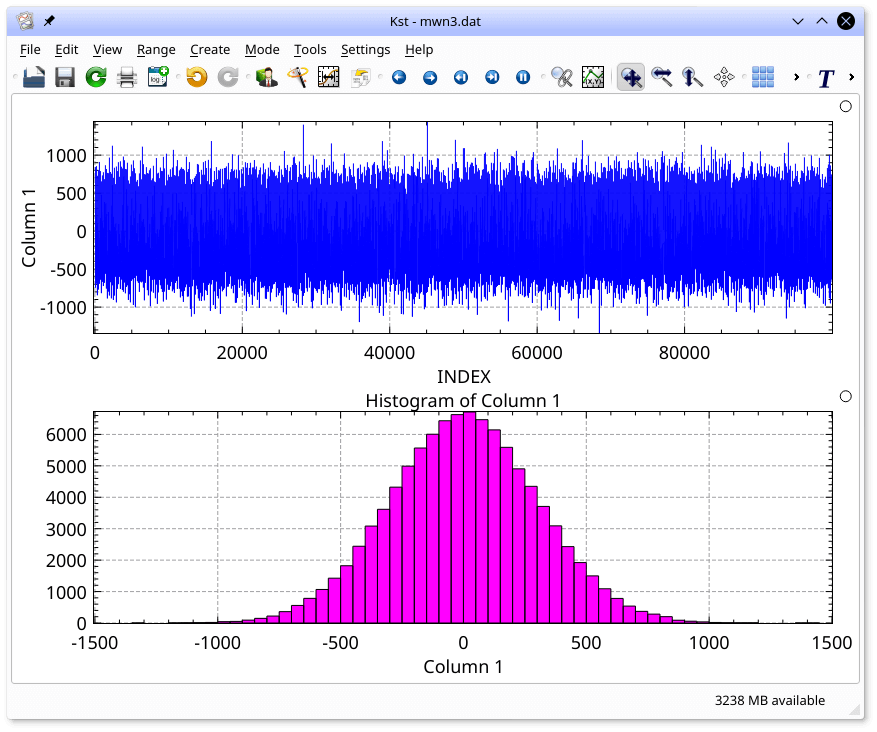
- Large selection of built-in plotting and data manipulation functions, such as histograms, equations, and power spectra.
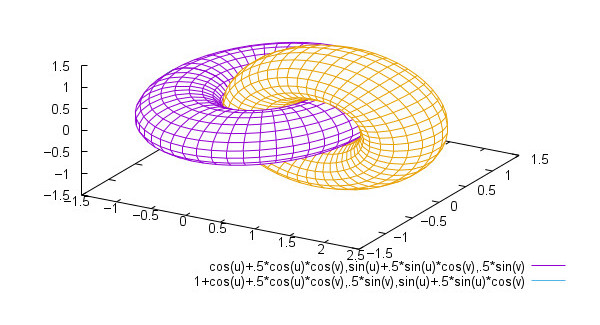
- Color mapping and contour mapping capabilities for three-dimensional data, as well as matrix and image support.
- Built-in filtering and curve fitting capabilities.
- Convenient command-line interface.
- Powerful graphical user interface with non-modal dialogs for an optimized workflow.
- Support for several popular data formats.
- Multiple tabs.
- Extended annotation objects similar to vector graphics applications.
- High-quality export to bitmap or vector formats.
- Supports ASCII, Dirfile/Getdata, netCDF including metadata, CFitsIO, QImage-compatible image types and Matlab’s .mat format with support from the matio library.
- Fully scriptable in Python.
Website: kst-plot.kde.org
Support:
Developer: Barth Netterfield and contributors
License: GNU General Public License v2.0
Kst is written in C++. Learn C++ with our recommended free books and free tutorials.
Related Software
| Plotting Tools | |
|---|---|
| matplotlib | Python based plotting system in a style similar to Matlab |
| ggplot2 | Powerful R package for declaratively creating graphics |
| gnuplot | Command-line driven interactive plotting program |
| ROOT | Solves the data analysis challenges of high-energy physics |
| Octave | Built-in plotting and visualization tools |
| DataMelt | Produces professional graphics with libraries for data manipulation |
| Veusz | Scientific plotting and graphing program |
| LabPlot | Data plotting and function analysis tool for KDE |
| PyQtGraph | Scientific Graphics and GUI Library for Python |
| Makie | interactive data visualizations and plotting for Julia |
| GLE | Graphics Layout Engine |
| PyVista | 3D plotting and mesh analysis |
| PLplot | Scientific plotting library |
| AlphaPlot | Fork of SciDAVis |
| SciDAVis | Scientific Data Analysis and Visualization |
| RLPlot | Generate publication quality graphs |
| Genius | Educational tool in mathematics and for research |
| ZeGrapher | 2D math and data plotter |
| Uniplot | Lightweight terminal plotting library for Python |
| Kst | Real-time large dataset viewing and plotting tool |
| Ctioga2 | Command-line plotting utility |
| Plots | Simple graph plotting app for GNOME |
| brplot | Ssmall application and library that plots data |
| SSPlot | Simple plotting utility and numerical simulator |
| Charta | Generate colorful terminal graphs |
| Incplot | Command like tool for drawing great looking plots in the terminal |
Read our verdict in the software roundup.
 Explore our comprehensive directory of recommended free and open source software. Our carefully curated collection spans every major software category. Explore our comprehensive directory of recommended free and open source software. Our carefully curated collection spans every major software category.This directory is part of our ongoing series of informative articles for Linux enthusiasts. It features hundreds of detailed reviews, along with open source alternatives to proprietary solutions from major corporations such as Google, Microsoft, Apple, Adobe, IBM, Cisco, Oracle, and Autodesk. You’ll also find interesting projects to try, hardware coverage, free programming books and tutorials, and much more. Discovered a useful open source Linux program that we haven’t covered yet? Let us know by completing this form. |