A plotting tool is computer software which helps to analyze and visualize data, often of a scientific nature. Using this type of software, users can generate plots of functions, data and data fits. Software of this nature typically includes additional functionality, such as data analysis functions including curve fitting.
A good plotting tool is very important for generating professional looking graphics for inclusion in academic papers. However, plotting tools are not just useful for academics, engineers, and scientists. Many users will need to plot graphs for other purposes such as presentations.
Fortunately, Linux is well endowed with plotting software. There are some heavyweight commercial Linux applications which include plotting functionality.Without access to their source code, you have limited understanding of how the software functions, and how to change it. The license costs are also very expensive. And we are fervent advocates of open source software. The purpose of this article is to help promote open source plotting tools that are available.
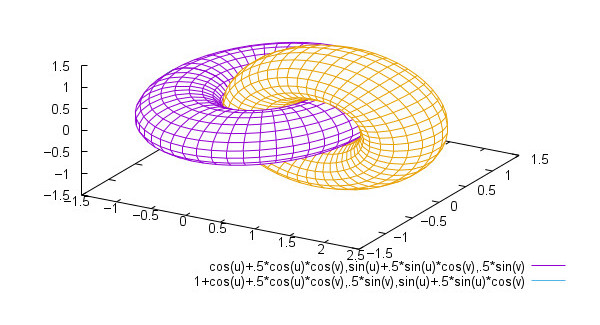
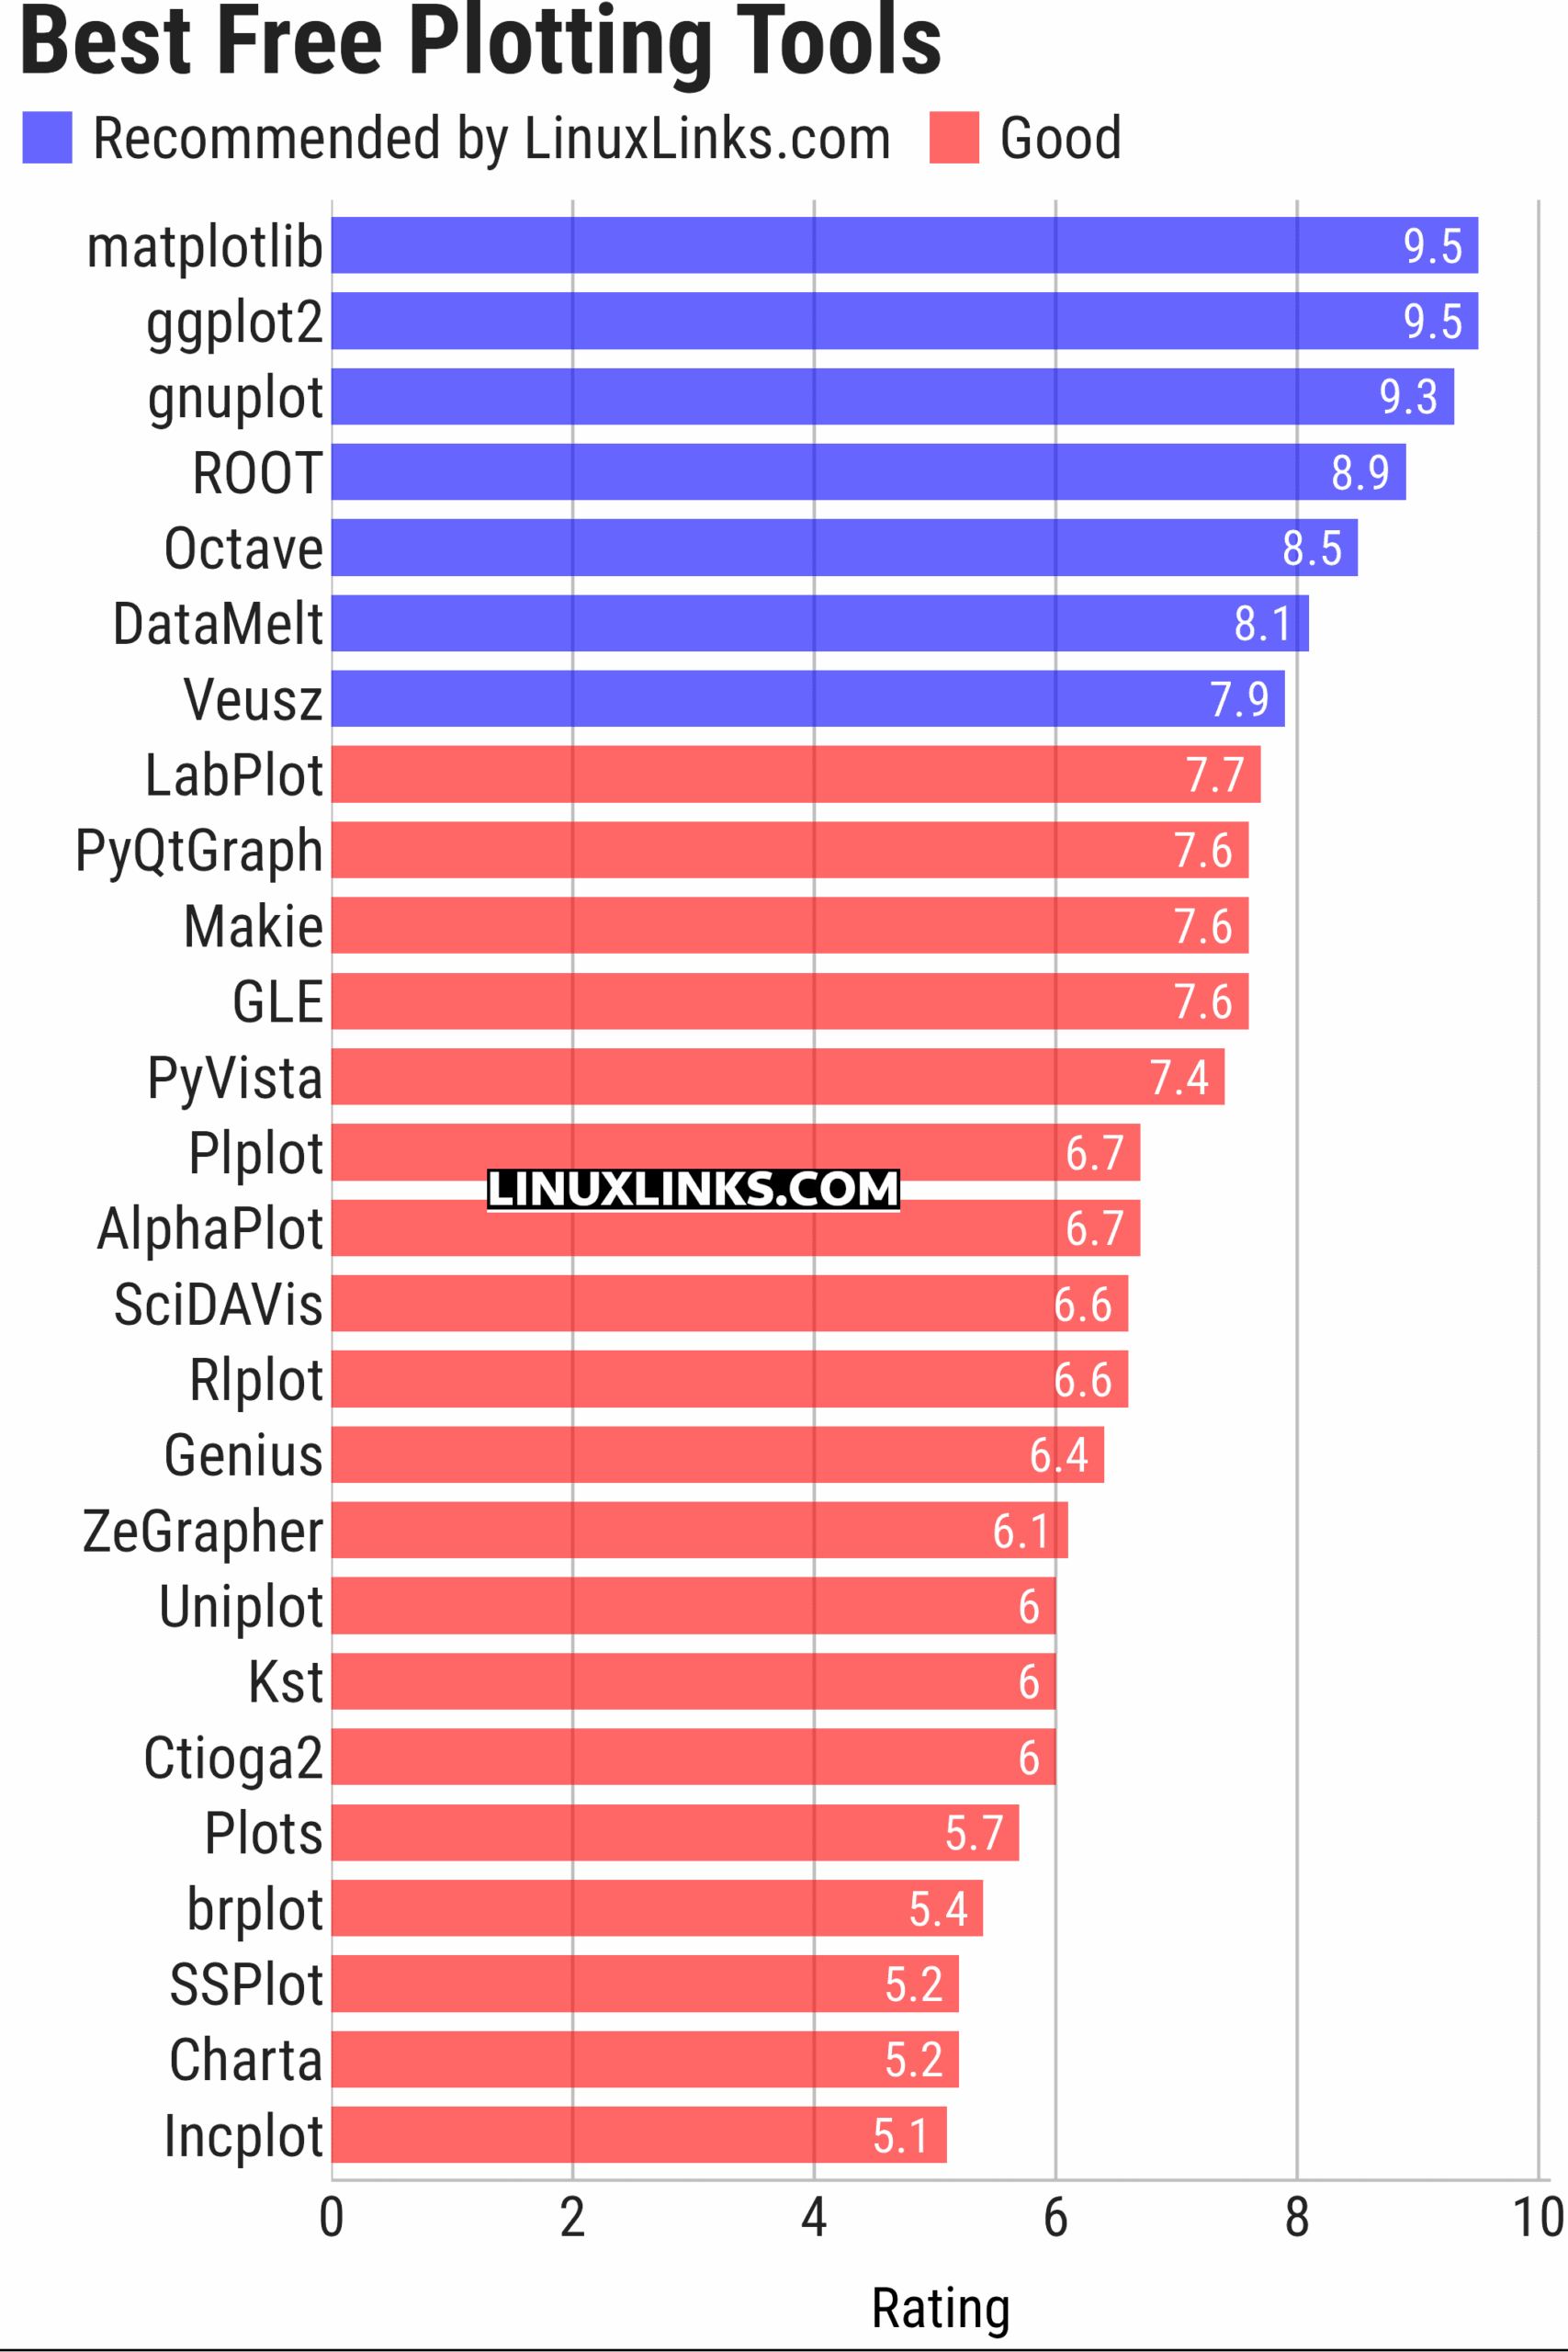
To provide an insight into the quality of software that is available, we have compiled a list of 19 excellent plotting tools. Many of the applications are very mature. For example, gnuplot has been in development since the mid-1980s.
The choice of plotting software may depend on which programming language you prefer. For example, if you love Python, matplotlib is an ideal candidate as it’s written in, and designed specifically for Python. Whereas, if you’re keen on the R programming language, you’ll probably prefer ggplot2, which is one of the most popular R packages. With good reason, it offers a powerful model of graphics that removes a lot of the difficulty in making complex multi-players graphics. R does come with “base graphics” which are the traditional plotting functions distributed with R. But gpplot2 takes graphics to the next level.
Hopefully, there will be something of interest for anyone interested in producing high quality graphs. We highly recommend matplotlib, ggplot2, gnuplot, and ROOT, but the others are all worth investigating.
Let’s explore the 26 plotting tools at hand. For each title we have compiled its own portal page, a full description with an in-depth analysis of its features, a screenshot of the software in action, together with links to relevant resources.
| Plotting Tools | |
|---|---|
| matplotlib | Python based plotting system in a style similar to Matlab |
| ggplot2 | Powerful R package for declaratively creating graphics |
| gnuplot | Command-line driven interactive plotting program |
| ROOT | Solves the data analysis challenges of high-energy physics |
| Octave | Built-in plotting and visualization tools |
| DataMelt | Produces professional graphics with libraries for data manipulation |
| Veusz | Scientific plotting and graphing program |
| LabPlot | Data plotting and function analysis tool for KDE |
| PyQtGraph | Scientific Graphics and GUI Library for Python |
| Makie | interactive data visualizations and plotting for Julia |
| GLE | Graphics Layout Engine |
| PyVista | 3D plotting and mesh analysis |
| PLplot | Scientific plotting library |
| AlphaPlot | Fork of SciDAVis |
| SciDAVis | Scientific Data Analysis and Visualization |
| RLPlot | Generate publication quality graphs |
| Genius | Educational tool in mathematics and for research |
| ZeGrapher | 2D math and data plotter |
| Uniplot | Lightweight terminal plotting library for Python |
| Kst | Real-time large dataset viewing and plotting tool |
| Ctioga2 | Command-line plotting utility |
| Plots | Simple graph plotting app for GNOME |
| brplot | Ssmall application and library that plots data |
| SSPlot | Simple plotting utility and numerical simulator |
| Charta | Generate colorful terminal graphs |
| Incplot | Command like tool for drawing great looking plots in the terminal |
This article has been updated to reflect the changes outlined in our recent announcement.
 Explore our comprehensive directory of recommended free and open source software. Our carefully curated collection spans every major software category. Explore our comprehensive directory of recommended free and open source software. Our carefully curated collection spans every major software category.This directory is part of our ongoing series of informative articles for Linux enthusiasts. It features hundreds of detailed reviews, along with open source alternatives to proprietary solutions from major corporations such as Google, Microsoft, Apple, Adobe, IBM, Cisco, Oracle, and Autodesk. You’ll also find interesting projects to try, hardware coverage, free programming books and tutorials, and much more. Know a useful open source Linux program that we haven’t covered yet? Let us know by completing this form. |