ggplot2 is a powerful and flexible R package for declaratively creating graphics, based on The Grammar of Graphics.
You provide the data, tell ggplot2 how to map variables to aesthetics, what graphical primitives to use, and it takes care of the details.
The Grammar of Graphics is a concept where you independently specify plot building blocks and combine them to create just about any kind of graphical display you want.
Read our interactive tutorial for data science using R and RStudio. No programming knowledge required.
Building blocks of a graph include:
- data.
- aesthetic mapping – aesthetic means “something you can see”.
- geometric object – the actual marks we put on a plot.
- statistical transformations.
- scales – control aesthetic mapping.
- coordinate system.
- position adjustments.
- faceting – this means small multiples, separa
ggplot2 has been under development for more than 10 years.
Key Features
- Consistent underlying grammar of graphics.
- Plot specification at a high level of abstraction.
- Very flexible.
- Theme system for polishing plot appearance – there are various built-in themes, and other third party themes are available.
- Mature and complete graphics system.
- Many users, active mailing list.
Website: ggplot2.tidyverse.org
Support: Manual, GitHub Code Repository
Developer: Hadley Wickham, Winston Chang, Lionel Henry, Thomas Lin Pedersen, Kohske Takahashi, Claus Wilke, Kara Woo, RStudio
License: GNU General Public License v2.0
If you are new to R, check out these excellent free R programming books.
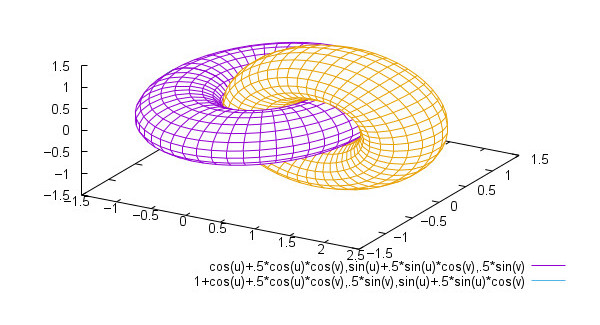
Here’s an example chart produced using ggplot2.
ggplot2 is written in R. Learn R with our recommended free books and free tutorials.
Related Software
| Plotting Tools | |
|---|---|
| matplotlib | Python based plotting system in a style similar to Matlab |
| ggplot2 | Powerful R package for declaratively creating graphics |
| gnuplot | Command-line driven interactive plotting program |
| ROOT | Solves the data analysis challenges of high-energy physics |
| Octave | Built-in plotting and visualization tools |
| DataMelt | Produces professional graphics with libraries for data manipulation |
| Veusz | Scientific plotting and graphing program |
| LabPlot | Data plotting and function analysis tool for KDE |
| PyQtGraph | Scientific Graphics and GUI Library for Python |
| Makie | interactive data visualizations and plotting for Julia |
| GLE | Graphics Layout Engine |
| PyVista | 3D plotting and mesh analysis |
| PLplot | Scientific plotting library |
| AlphaPlot | Fork of SciDAVis |
| SciDAVis | Scientific Data Analysis and Visualization |
| RLPlot | Generate publication quality graphs |
| Genius | Educational tool in mathematics and for research |
| ZeGrapher | 2D math and data plotter |
| Uniplot | Lightweight terminal plotting library for Python |
| Kst | Real-time large dataset viewing and plotting tool |
| Ctioga2 | Command-line plotting utility |
| Plots | Simple graph plotting app for GNOME |
| brplot | Ssmall application and library that plots data |
| SSPlot | Simple plotting utility and numerical simulator |
| Charta | Generate colorful terminal graphs |
| Incplot | Command like tool for drawing great looking plots in the terminal |
Read our verdict in the software roundup.
 Explore our comprehensive directory of recommended free and open source software. Our carefully curated collection spans every major software category. Explore our comprehensive directory of recommended free and open source software. Our carefully curated collection spans every major software category.This directory is part of our ongoing series of informative articles for Linux enthusiasts. It features hundreds of detailed reviews, along with open source alternatives to proprietary solutions from major corporations such as Google, Microsoft, Apple, Adobe, IBM, Cisco, Oracle, and Autodesk. You’ll also find interesting projects to try, hardware coverage, free programming books and tutorials, and much more. Discovered a useful open source Linux program that we haven’t covered yet? Let us know by completing this form. |
Please read our Comment Policy before commenting.