
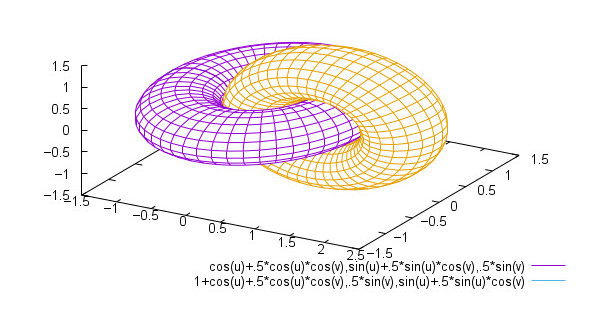
GLE (Graphics Layout Engine) is a graphics package for producing publication-quality scientific graphs, technical diagrams and mathematical figures. Its principal interface is a graphics scripting language that describes the appearance and placement of objects using textual instructions rather than requiring every component to be drawn manually.
The program is particularly useful when figures must be reproduced consistently, adjusted to precise dimensions or incorporated into scientific papers. A script can describe curves, mathematical functions, geometric objects, labels and page layout, allowing changes to be made systematically. GLE also includes QGLE, a graphical front end that displays the generated figures and provides interactive controls for editing objects. The combination of scripting and graphical editing allows users to work at different levels of precision, from adjusting individual line widths to constructing complex diagrams from reusable procedures.
This is free and open source software.
Key Features
- Scientific plotting – creates function plots, scatter graphs, histograms, bar charts, contour plots, colour maps and surface plots.
- Vector drawing – supports lines, circles, ellipses, boxes, curves, arrows, filled shapes and text objects.
- Graphics scripting – provides variables, conditional statements, loops, subroutines and mathematical expressions.
- Reusable drawing procedures – allows complex figures and diagrams to be assembled from predefined graphical operations.
- Graph module – offers precise control over axes, scales, tick marks, curve styles, line widths and graphical annotations.
- Advanced drawing – includes paths, clipping, rotation, transparency and coordinate transformations.
- Mathematical typography – integrates LaTeX for equations, symbols and high-quality scientific text.
- External graphics – incorporates bitmap images, PostScript files and other GLE drawings into figures.
- QGLE editor – provides a graphical preview and interactive manipulation of drawing objects and their properties.
- Precise layout – controls page dimensions, object positions and graphical measurements for publication output.
- Graphics export – produces EPS, PostScript, PDF, JPEG and PNG files from the same drawing instructions.
- Cross-platform support – runs on Linux, macOS, and Windows.
Website: www.gle-graphics.org
Support:
Developer: Chris Pugmire, Jan Struyf and contributors
License: BSD 3-Clause ‘New’ or ‘Revised’ License (GLE); GNU General Public License (QGLE)
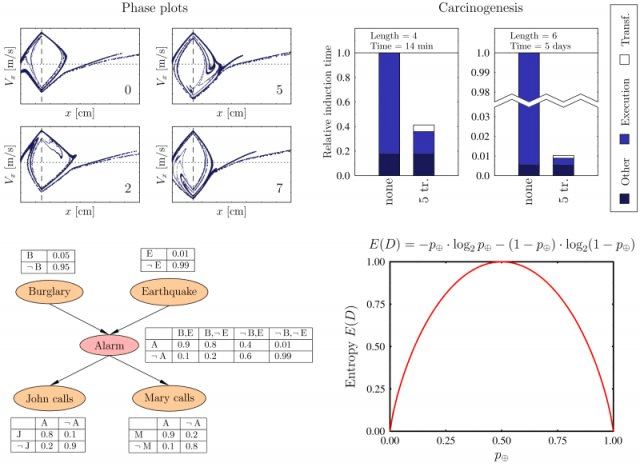
GLE is written in C++. Learn C++ with our recommended free books and free tutorials.
Related Software
| Plotting Tools | |
|---|---|
| matplotlib | Python based plotting system in a style similar to Matlab |
| ggplot2 | Powerful R package for declaratively creating graphics |
| gnuplot | Command-line driven interactive plotting program |
| ROOT | Solves the data analysis challenges of high-energy physics |
| Octave | Built-in plotting and visualization tools |
| DataMelt | Produces professional graphics with libraries for data manipulation |
| Veusz | Scientific plotting and graphing program |
| LabPlot | Data plotting and function analysis tool for KDE |
| PyQtGraph | Scientific Graphics and GUI Library for Python |
| Makie | interactive data visualizations and plotting for Julia |
| GLE | Graphics Layout Engine |
| PyVista | 3D plotting and mesh analysis |
| PLplot | Scientific plotting library |
| AlphaPlot | Fork of SciDAVis |
| SciDAVis | Scientific Data Analysis and Visualization |
| RLPlot | Generate publication quality graphs |
| Genius | Educational tool in mathematics and for research |
| ZeGrapher | 2D math and data plotter |
| Uniplot | Lightweight terminal plotting library for Python |
| Kst | Real-time large dataset viewing and plotting tool |
| Ctioga2 | Command-line plotting utility |
| Plots | Simple graph plotting app for GNOME |
| brplot | Ssmall application and library that plots data |
| SSPlot | Simple plotting utility and numerical simulator |
| KmPlot | Supports Cartesian, parametric, polar, implicit and differential plots |
| Charta | Generate colorful terminal graphs |
| Incplot | Command like tool for drawing great looking plots in the terminal |
Read our verdict in the software roundup.
 LinuxLinks helps you discover the best free and open source software for Linux. Explore our extensive collection of recommended applications, including alternatives to popular proprietary software. We also publish software reviews, Linux tutorials, hardware reviews, free programming books and articles covering the wider open source community. Browse our Linux resources to discover more. Know a useful free and open source Linux application we haven't covered? Suggest a program for inclusion. Has your software been featured on LinuxLinks? Display one of our Featured on LinuxLinks badges on your website or GitHub README. |
Please read our Comment Policy before commenting.