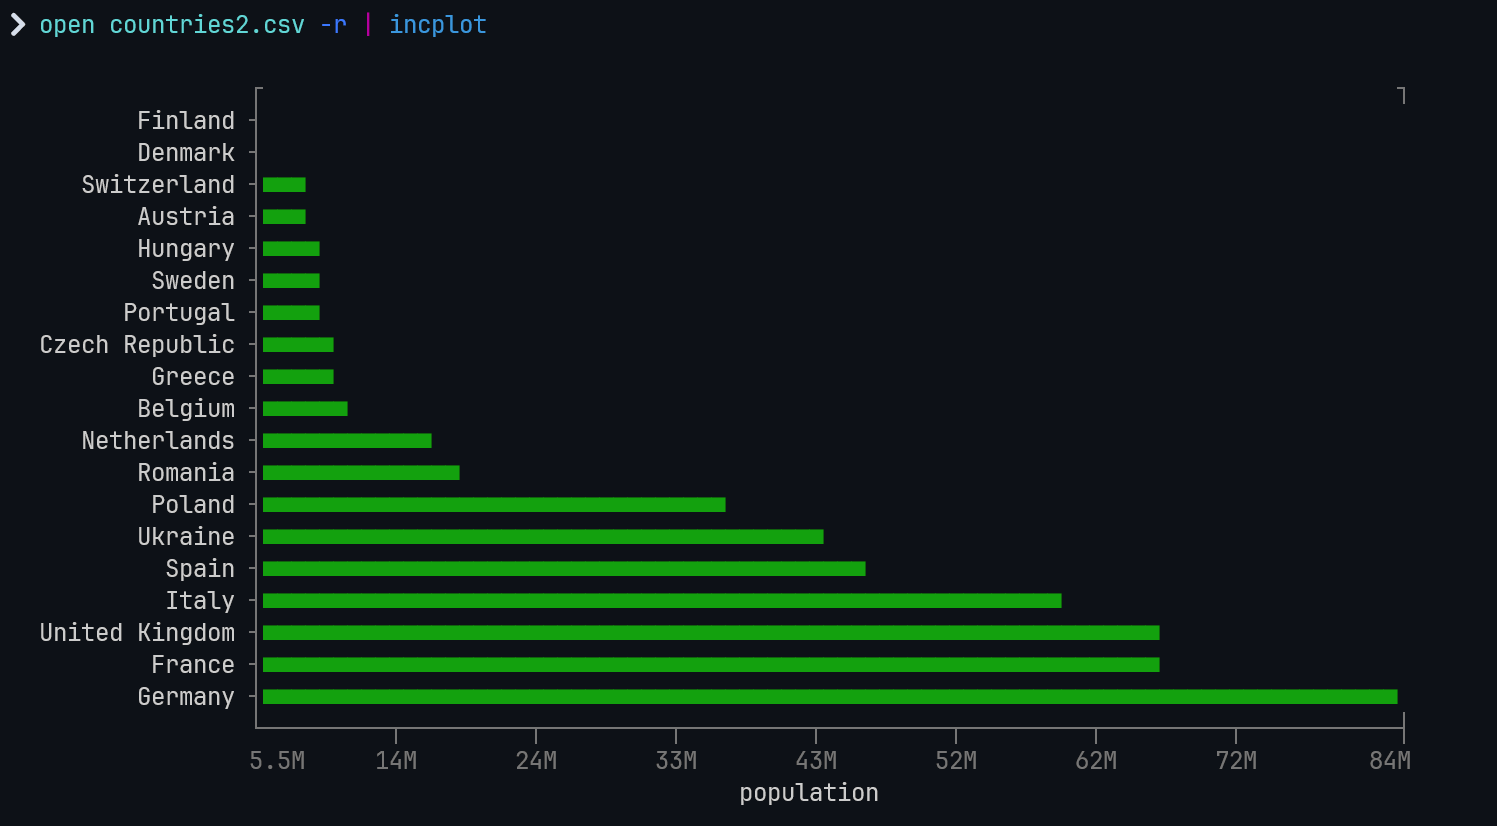
Incplot is a command like tool for drawing great looking plots in the terminal using Unicode characters.
Automatically infers what to display and how based on the data piped in.
This is free and open source software.
Key Features
- Great looking plots ‘out of the box’.
- Zero configuration required, super simple to use.
- No command line arguments necessary most of the time due to automatic inference.
- Users can optionally specify some or all arguments in any (sensible) combination.
- Accepts piped in data in JSON, JSON Lines, NDJSON, CSV, TSV.
- Fast.
- Powerful coloring support through integrated color schemes.
- Powerful ability to ‘grab’ currently used colors/scheme from the user’s terminal and use it (if supported by the terminal app) with sensible fallback.
- Automatic but configurable filtering of extreme values.
- Automatic sizing.
- Automatic value labels and scaling with metric prefixes.
- Automatic string label sizing (ie. shortening where necessary).
- Automatic tickmarks.
- Automatic legend.
- Reasonable error messages (especially when the user asks for something that is impossible/unsupported).
- Cross platform support (Linux, macOS, and Windows).
Website: github.com/InCom-0/incplot
Support:
Developer: Michal Lurie
License: MIT License
Incplot is written in C++. Learn C++ with our recommended free books and free tutorials.
Related Software
| Plotting Tools | |
|---|---|
| matplotlib | Python based plotting system in a style similar to Matlab |
| ggplot2 | Powerful R package for declaratively creating graphics |
| gnuplot | Command-line driven interactive plotting program |
| ROOT | Solves the data analysis challenges of high-energy physics |
| Octave | Built-in plotting and visualization tools |
| DataMelt | Produces professional graphics with libraries for data manipulation |
| Veusz | Scientific plotting and graphing program |
| LabPlot | Data plotting and function analysis tool for KDE |
| PyQtGraph | Scientific Graphics and GUI Library for Python |
| Makie | interactive data visualizations and plotting for Julia |
| GLE | Graphics Layout Engine |
| PyVista | 3D plotting and mesh analysis |
| PLplot | Scientific plotting library |
| AlphaPlot | Fork of SciDAVis |
| SciDAVis | Scientific Data Analysis and Visualization |
| RLPlot | Generate publication quality graphs |
| Genius | Educational tool in mathematics and for research |
| ZeGrapher | 2D math and data plotter |
| Uniplot | Lightweight terminal plotting library for Python |
| Kst | Real-time large dataset viewing and plotting tool |
| Ctioga2 | Command-line plotting utility |
| Plots | Simple graph plotting app for GNOME |
| brplot | Ssmall application and library that plots data |
| SSPlot | Simple plotting utility and numerical simulator |
| Charta | Generate colorful terminal graphs |
| Incplot | Command like tool for drawing great looking plots in the terminal |
Read our verdict in the software roundup.
 Explore our comprehensive directory of recommended free and open source software. Our carefully curated collection spans every major software category. Explore our comprehensive directory of recommended free and open source software. Our carefully curated collection spans every major software category.This directory is part of our ongoing series of informative articles for Linux enthusiasts. It features hundreds of detailed reviews, along with open source alternatives to proprietary solutions from major corporations such as Google, Microsoft, Apple, Adobe, IBM, Cisco, Oracle, and Autodesk. You’ll also find interesting projects to try, hardware coverage, free programming books and tutorials, and much more. Discovered a useful open source Linux program that we haven’t covered yet? Let us know by completing this form. |