
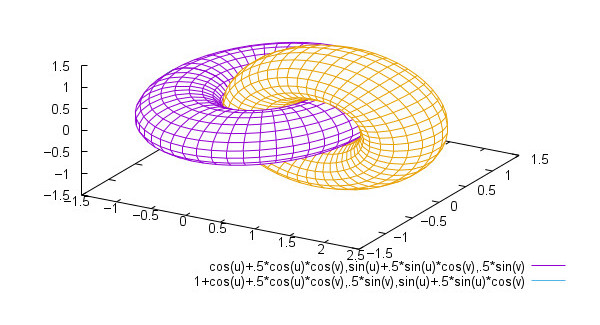
Makie.jl is an interactive plotting and data visualisation ecosystem for the Julia programming language.
It supports native-window and browser-based visualisation, high-quality graphics export, and multiple rendering backends for different use cases.
The backend packages GLMakie, WGLMakie, CairoMakie and RPRMakie add different functionalities: You can use Makie to interactively explore your data and create simple GUIs in native windows or web browsers, export high-quality vector graphics or even raytrace with physically accurate lighting.
This is free and open source software.
Key Features
- Provides interactive plotting and visualisation for Julia.
- Supports multiple backends including GLMakie, WGLMakie, CairoMakie, and RPRMakie.
- Can be used in native windows and web browsers.
- Exports high-quality vector graphics.
- Supports raytraced rendering with physically accurate lighting.
- Can be used to build simple graphical interfaces.
Website: github.com/MakieOrg/Makie.jl
Support:
Developer: MakieOrg
License: MIT License
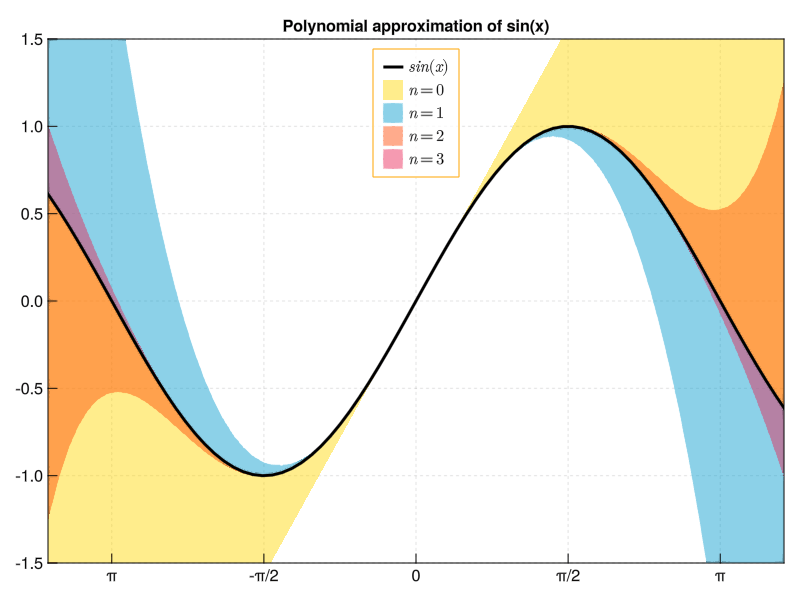
Makie is written in Julia. Learn Julia with our recommended free books and free tutorials.
Related Software
| Plotting Tools | |
|---|---|
| matplotlib | Python based plotting system in a style similar to Matlab |
| ggplot2 | Powerful R package for declaratively creating graphics |
| gnuplot | Command-line driven interactive plotting program |
| ROOT | Solves the data analysis challenges of high-energy physics |
| Octave | Built-in plotting and visualization tools |
| DataMelt | Produces professional graphics with libraries for data manipulation |
| Veusz | Scientific plotting and graphing program |
| LabPlot | Data plotting and function analysis tool for KDE |
| PyQtGraph | Scientific Graphics and GUI Library for Python |
| Makie | interactive data visualizations and plotting for Julia |
| GLE | Graphics Layout Engine |
| PyVista | 3D plotting and mesh analysis |
| PLplot | Scientific plotting library |
| AlphaPlot | Fork of SciDAVis |
| SciDAVis | Scientific Data Analysis and Visualization |
| RLPlot | Generate publication quality graphs |
| Genius | Educational tool in mathematics and for research |
| ZeGrapher | 2D math and data plotter |
| Uniplot | Lightweight terminal plotting library for Python |
| Kst | Real-time large dataset viewing and plotting tool |
| Ctioga2 | Command-line plotting utility |
| Plots | Simple graph plotting app for GNOME |
| brplot | Ssmall application and library that plots data |
| SSPlot | Simple plotting utility and numerical simulator |
| KmPlot | Supports Cartesian, parametric, polar, implicit and differential plots |
| Charta | Generate colorful terminal graphs |
| Incplot | Command like tool for drawing great looking plots in the terminal |
Read our verdict in the software roundup.
 Explore our carefully curated directory of recommended free and open source software, covering every major software category. Explore our carefully curated directory of recommended free and open source software, covering every major software category.The directory forms part of our extensive collection of articles for Linux enthusiasts. It includes hundreds of detailed reviews, together with free and open source alternatives to proprietary software from companies such as Google, Microsoft, Apple, Adobe, IBM, Cisco, Oracle, and Autodesk. LinuxLinks also covers interesting projects worth exploring, Linux-compatible hardware, free programming books and tutorials, and much more. Know a useful free and open source Linux application that we haven’t covered? Tell us about it using our submission form. |
Please read our Comment Policy before commenting.