
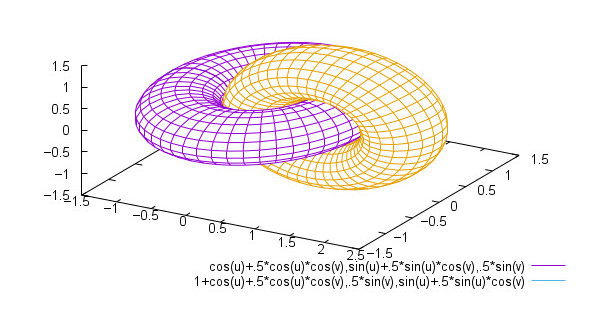
Uniplot is a lightweight terminal plotting library for Python.
It is designed for situations where users need quick visualisation without relying on graphical desktop dependencies or notebook-only workflows.
This is free and open source software.
Key Features
- Creates plots directly in the terminal.
- Uses Unicode output for higher visual resolution.
- Works well in console and CI workflows.
- Does not depend on graphical plotting environments.
- Includes histogram support in addition to line plotting.
Website: github.com/olavolav/uniplot
Support:
Developer: Olav Stetter
License: MIT License

Uniplot is written in Python. Learn Python with our recommended free books and free tutorials.
Related Software
| Plotting Tools | |
|---|---|
| matplotlib | Python based plotting system in a style similar to Matlab |
| ggplot2 | Powerful R package for declaratively creating graphics |
| gnuplot | Command-line driven interactive plotting program |
| ROOT | Solves the data analysis challenges of high-energy physics |
| Octave | Built-in plotting and visualization tools |
| DataMelt | Produces professional graphics with libraries for data manipulation |
| Veusz | Scientific plotting and graphing program |
| LabPlot | Data plotting and function analysis tool for KDE |
| PyQtGraph | Scientific Graphics and GUI Library for Python |
| Makie | interactive data visualizations and plotting for Julia |
| GLE | Graphics Layout Engine |
| PyVista | 3D plotting and mesh analysis |
| PLplot | Scientific plotting library |
| AlphaPlot | Fork of SciDAVis |
| SciDAVis | Scientific Data Analysis and Visualization |
| RLPlot | Generate publication quality graphs |
| Genius | Educational tool in mathematics and for research |
| ZeGrapher | 2D math and data plotter |
| Uniplot | Lightweight terminal plotting library for Python |
| Kst | Real-time large dataset viewing and plotting tool |
| Ctioga2 | Command-line plotting utility |
| Plots | Simple graph plotting app for GNOME |
| brplot | Ssmall application and library that plots data |
| SSPlot | Simple plotting utility and numerical simulator |
| KmPlot | Supports Cartesian, parametric, polar, implicit and differential plots |
| Charta | Generate colorful terminal graphs |
| Incplot | Command like tool for drawing great looking plots in the terminal |
Read our verdict in the software roundup.
 LinuxLinks helps you discover the best free and open source software for Linux. Explore our extensive collection of recommended applications, including alternatives to popular proprietary software. We also publish software reviews, Linux tutorials, hardware reviews, free programming books and articles covering the wider open source community. Browse our Linux resources to discover more. Know a useful free and open source Linux application we haven't covered? Suggest a program for inclusion. Has your software been featured on LinuxLinks? Display one of our Featured on LinuxLinks badges on your website or GitHub README. |
Please read our Comment Policy before commenting.