A plotting tool is computer software which helps to analyse and visualize data, often of a scientific nature. Here’s our verdict.
Read more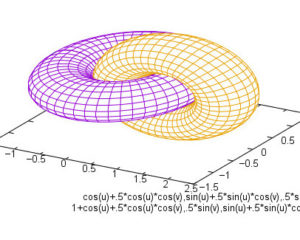
A plotting tool is computer software which helps to analyse and visualize data, often of a scientific nature. Here’s our verdict.
Read more
Uniplot is aimed at users who need quick visualisation without relying on graphical desktop dependencies or notebook-only workflows.
Read more
Makie.jl is an interactive plotting and data visualisation ecosystem for the Julia programming language.
Read more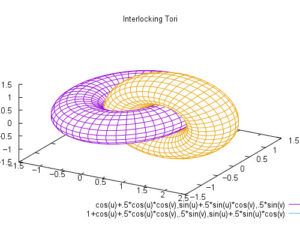
Incplot is a command like tool for drawing great looking plots in the terminal using Unicode characters.
Read more
brplot – [b]etter [r]l[plot] is a small application and library that plots data. It works as a library or as an standalone application.
Read more
Python has a fantastic range of packages to produce mesmerizing visualizations. We recommend the best free and open source Python tools.
Read more
Charta is a utility written in Go to display small colored charts in the terminal.
Read more
SSPlot is a simple plotter and numerical solver, which can plot csv style plain text files with numerical data
Read more
Kst is a plotting tool written in C++ that provides both a command-line interface and a graphical user interface.
Read more
AlphaPlot is a computer program for interactive scientific graphing and data analysis. It can generate different types of 2D and 3D plots.
Read more
PyVista offers 3D plotting and mesh analysis through a streamlined interface for the Visualization Toolkit (VTK).
Read more
Plots is a graph plotting app for GNOME. Plots makes it easy to visualise mathematical formulae.
Read more
gnuplot is a command-driven interactive function plotting program. Plot functions and data points in both 2D and 3D plots in many formats.
Read more
ggplot2 is a system for declaratively creating graphics, based on The Grammar of Graphics, the idea that you can build every graph from the same few components.
Read more
PLplot is a scientific plotting package. It is relatively small, portable, freely distributable, and is rich enough to satisfy most users.
Read more
Veusz is a scientific plotting and graphing program with a graphical user interface, designed to produce publication-ready 2D and 3D plots.
Read more
Ctioga is a powerful, open source command-line plotting system written in Ruby. It has been designed to rapidly make publication-quality graphs.
Read more
LabPlot is an open source data analysis and plotting program for the KDE desktop. This software is similar to Origin (a proprietary Windows application).
Read more
GLE (Graphics Layout Engine) is a high quality graphics package for scientists, combining a user friendly interface with a full range of facilities.
Read more
SciDAVis is an interactive application aimed at data analysis and publication-quality plotting.
Read more