
Last Updated on June 27, 2026
This article is part of a series looking at the Bosgame M7 Core Ultra 9 285H mini PC running Linux. In this series, I put this mini PC through its paces from a Linux perspective, comparing it with other systems, including desktops, to show how it really stacks up.
The Bosgame M7 is a recent addition to Bosgame’s wide range of mini PCs. This model is based on the Intel Core Ultra 9 285H processor with integrated Intel Arc 140T graphics. The processor has 16 cores and 16 threads with a CPU Mark of around 34,327. My machine came with 32GB of DDR5 5600 MT/s RAM and a 1TB PCIe 4.0 SSD, a configuration well-suited to heavy multitasking, development work, and media-rich workloads.
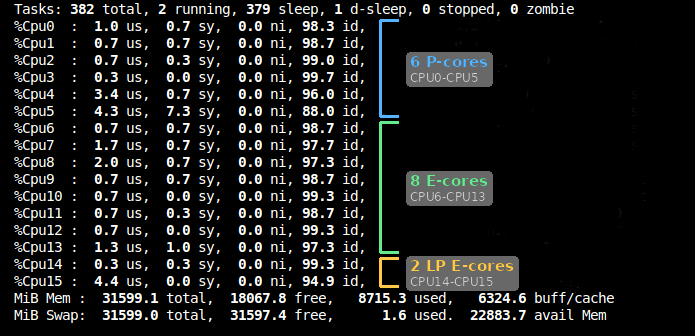
The Core Ultra 9 285H uses Intel’s hybrid architecture, combining 6 Performance-cores, 8 Efficient-cores, and 2 Low Power Efficient-cores. The P-cores deliver the strongest single-threaded performance. The E-cores add substantial multi-threaded throughput, while the LP E-cores are designed for light background work and low-power operation. Unlike older Intel mobile chips with Hyper-Threading, the 285H exposes 16 cores and 16 threads, so each core maps to a single logical CPU.
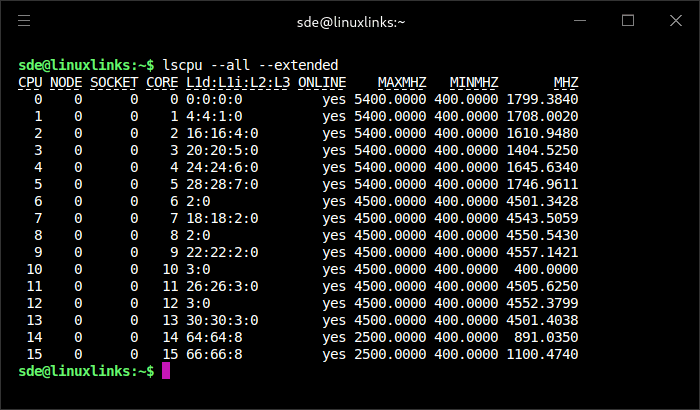
My annotated image is supported by the lscpu command, which reports the maximum clock frequency for each core type.
I’m interested in measuring the performance difference between the P-cores, E-cores, and LP E-cores. The Bosgame M7’s BIOS lets me disable specific cores, but that’s a fairly blunt approach. A simpler and more flexible method is to use the taskset utility, which lets a process run on selected CPU cores without changing the BIOS configuration.
I’ll start with Crafty, the chess engine benchmark available in the Phoronix Test Suite. It’s a useful first test because Crafty is single-threaded, so it only uses one CPU core. That makes the results much easier to interpret, as each run can be pinned to a specific core type and compared directly.
I can run the Crafty benchmark separately on a P-core, E-core, and LP E-core with the following commands:
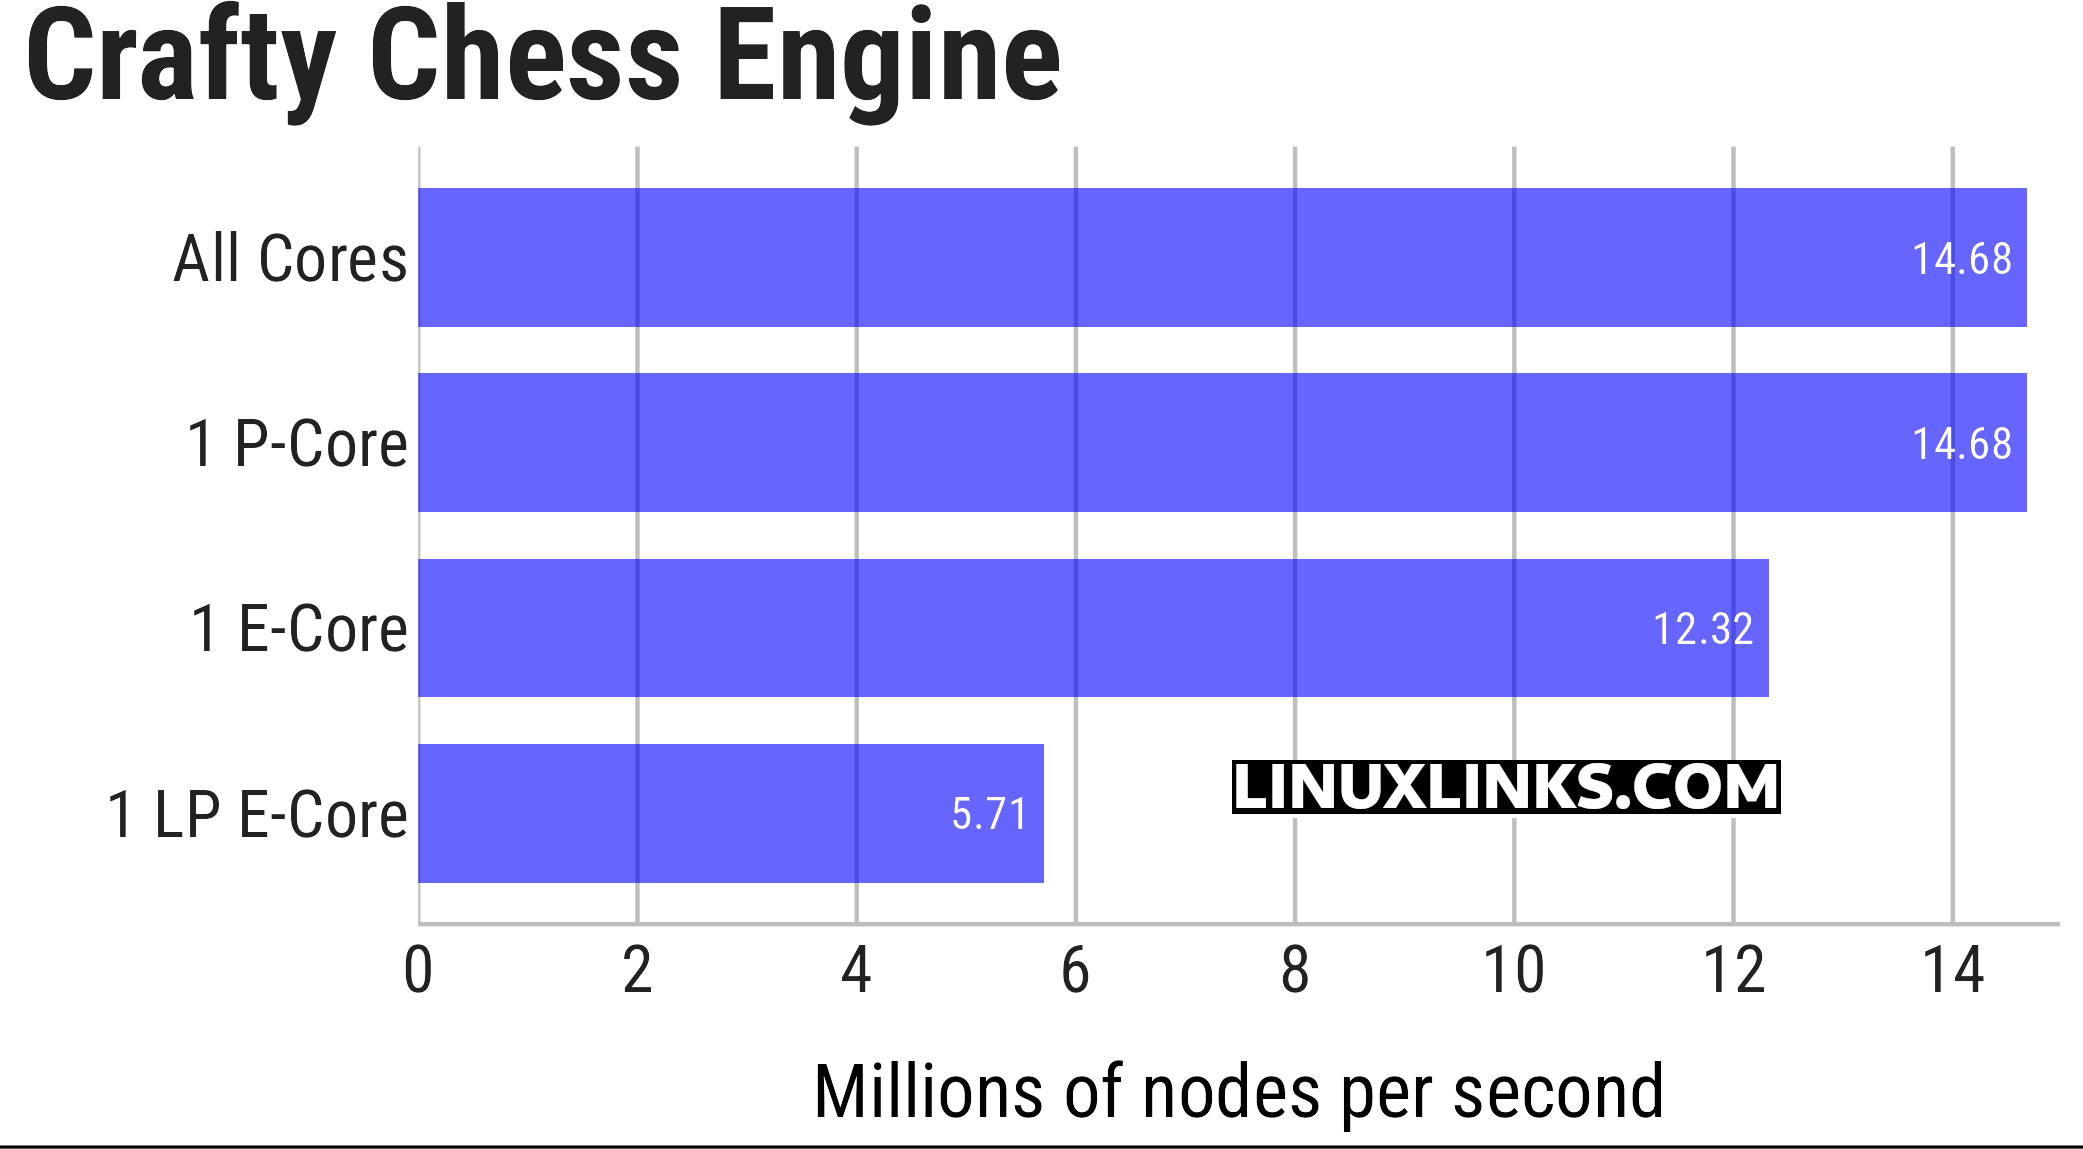
$ taskset -c 0 phoronix-test-suite benchmark crafty
$ taskset -c 6 phoronix-test-suite benchmark crafty
$ taskset -c 14 phoronix-test-suite benchmark crafty
Crafty shows the difference between the three core classes very neatly. With all cores available, the result is identical to running the benchmark on a single P-Core, which indicates the scheduler placed this single-threaded workload on a Performance core. A single E-Core remains surprisingly competitive, reaching around 84% of the P-Core’s performance. The LP E-Core is in a different class altogether, producing less than 40% of the P-Core’s throughput.
I previously ran the same Crafty benchmark on the Core Ultra 7 255H, which gives us a useful comparison with the Core Ultra 9 285H. The results are very close. With all cores available, and when pinned to a single P-Core, the 255H scored 14.26 million nodes per second, compared with 14.68 million nodes per second for the 285H. The E-Core results are similarly close, with the 255H scoring 12.00 million nodes per second against 12.32 million nodes per second for the 285H. Even the LP E-Core results are almost identical, at 5.63 and 5.71 million nodes per second respectively.
This shows that, for this single-threaded workload, there’s very little between the two processors. The Core Ultra 9 285H is marginally faster across all three core types, but only by around 1 to 3%. More importantly, both processors show the same pattern. A single E-Core delivers about 84% of the performance of a P-Core, while a single LP E-Core delivers just under 40%. That reinforces the point that Crafty is useful not only for comparing processors, but also for showing the performance gap between Intel’s different core classes.
Let’s take the results for Coremark, a benchmark that can use all of the Core Ultra 9 285H’s cores.
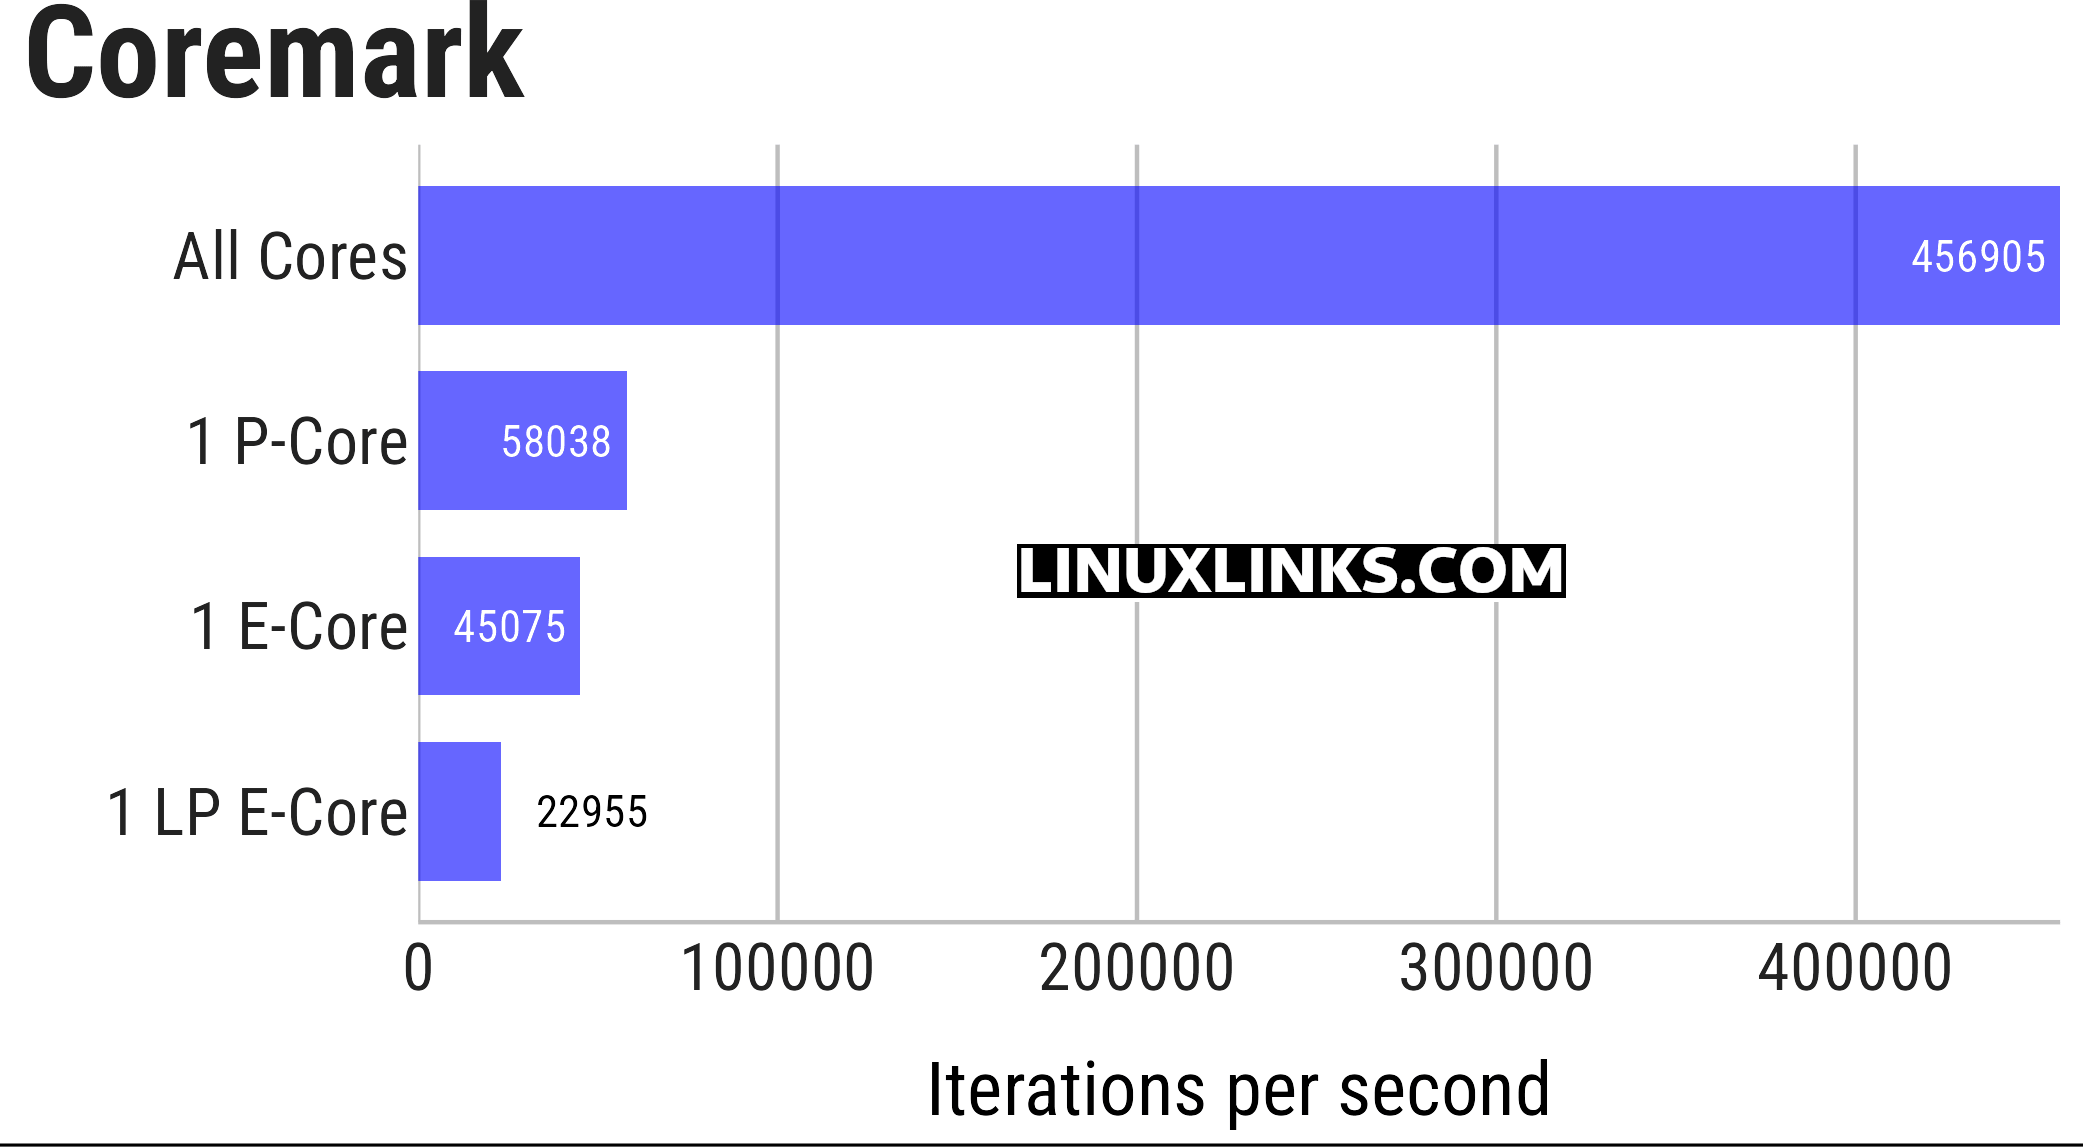
$ taskset -c 0 phoronix-test-suite benchmark coremark
$ taskset -c 6 phoronix-test-suite benchmark coremark
$ taskset -c 14 phoronix-test-suite benchmark coremark
Coremark gives a better indication of how the Core Ultra 9 285H behaves when the full processor is used. With all cores active, the benchmark reaches 456,905 iterations per second, which is almost eight times faster than running the test on a single P-Core. This contrasts with Crafty, where the all-core result matched the single P-Core result because the workload was effectively single-threaded.
Looking at the individual core types, the P-Core leads with 58,038 iterations per second. A single E-Core remains fairly competitive at 45,075 iterations per second, around 78% of the P-Core’s performance. The LP E-Core is much slower at 22,955 iterations per second, delivering roughly 40% of the P-Core result. This reinforces the same hierarchy seen in the Crafty test: P-Cores are best for maximum single-threaded performance, E-Cores are still capable, and LP E-Cores are clearly designed for lighter background work rather than heavy compute tasks.
I’ll also perform a similar exercise with the smallpt benchmark.
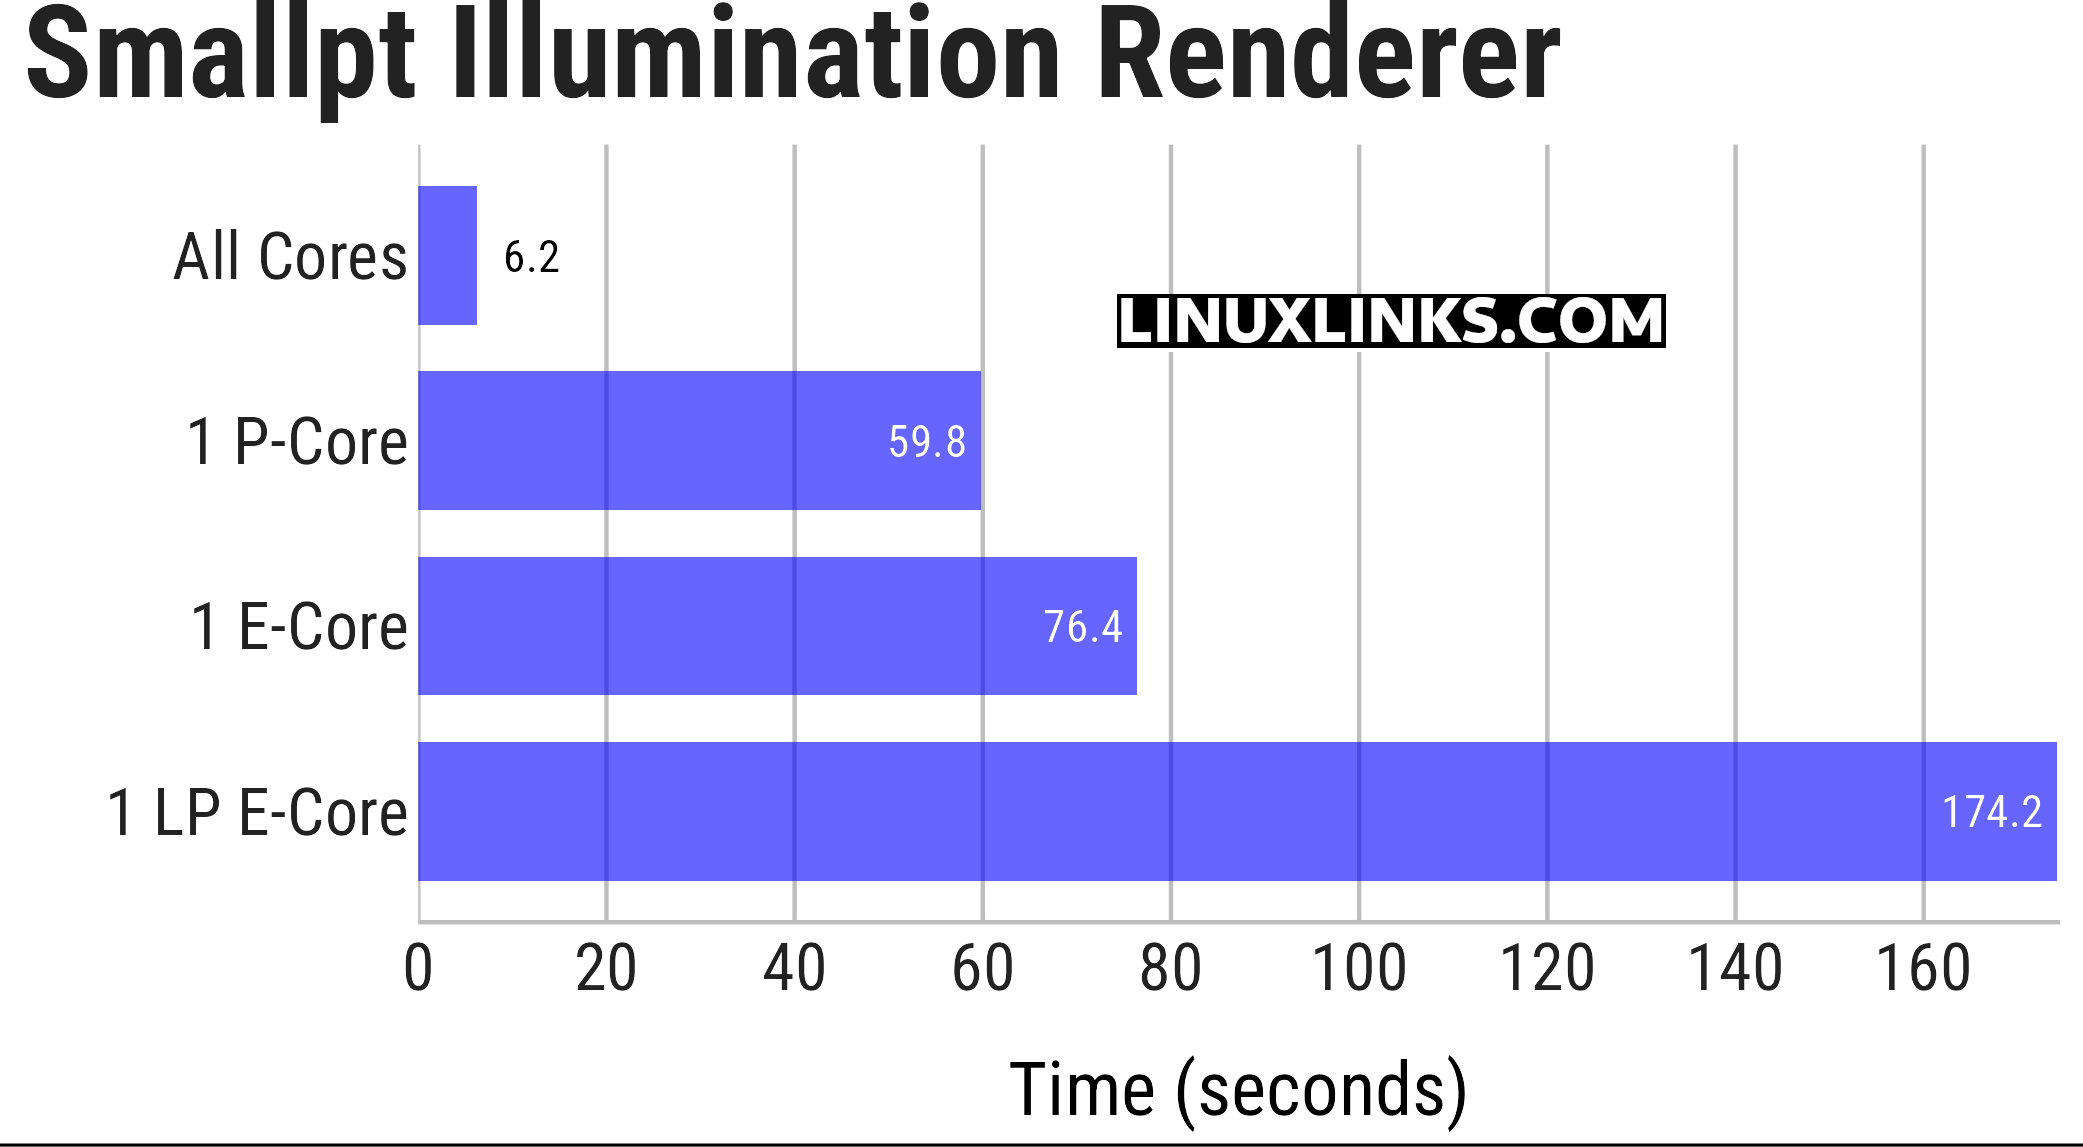
taskset -c 0 phoronix-test-suite benchmark smallpt
taskset -c 6 phoronix-test-suite benchmark smallpt
taskset -c 14 phoronix-test-suite benchmark smallpt
The smallpt benchmark is another good example of how much the Core Ultra 9 285H benefits from using all available cores. With all cores active, the render completes in just 6.2 seconds, compared with 59.8 seconds on a single P-Core. A single E-Core is slower at 76.4 seconds, but still reasonably competitive. The LP E-Core is much weaker for this kind of workload, taking 174.2 seconds, almost three times longer than the P-Core.
Complete list of articles in this series:
| Bosgame M7 Core Ultra 9 285H Mini PC | |
|---|---|
| Introduction | Introduction to the series and interrogation of the machine |
| Benchmarks | Benchmarking the Bosgame M7 Core Ultra 9 285H Mini PC |
| Power | Testing and comparing the power consumption |
| BIOS | In the world of computing, BIOS, which stands for Basic Input/Output System, plays a crucial role |
| Cores | Benchmarking the Bosgame M7’s Core Ultra 9 285H on Linux, comparing P-cores, E-cores and LP E-cores with Crafty, Coremark and smallpt. |
| Intel processors | P-Cores, E-Cores and LP E-Cores Compared Across 4 Intel Processors |
| More articles will be published next week | |
The LP E-Cores look very weedy.
Yes, that’s fair to a degree.
They do look weak in these compute-heavy benchmarks, especially beside the P-Cores and even the normal E-Cores. But that’s partly the point: the LP E-Cores aren’t there to win benchmarks. They’re designed for light background work and low-power operation. For heavy Linux workloads, the P-Cores and E-Cores matter far more.
What I find interesting here is how misleading the simple “16 cores” label can be. The 285H clearly isn’t a chip with 16 broadly similar cores. It’s more like three CPUs in one: fast P-Cores, surprisingly capable E-Cores, and a couple of LP E-Cores that are really there for housekeeping rather than heavy lifting.