This is a new series looking at the Bosgame M7 Core Ultra 9 285H mini PC running Linux. In this series, I’ll put this mini PC through its paces from a Linux perspective, comparing it with other systems, including desktops, to show how it really stacks up.
The Bosgame M7 is a recent addition to Bosgame’s wide range of mini PCs. This model is based on the Intel Core Ultra 9 285H processor with integrated Intel Arc 140T graphics. The processor has 16 cores and 16 threads with a CPU Mark of around 34,327. My machine came with 32GB of DDR5 5600MHz RAM and a 1TB PCIe 4.0 SSD, a configuration well-suited to heavy multitasking, development work, and media-rich workloads.
For this article in the series, I’ve benchmarked the Bosgame M7 using a range of tests, most of them run with the Phoronix Test Suite. I’ve compared its results against eight other systems: the Bosgame M4 Plus, Bosgame M6, as well as a Ryzen 9 8945HS mini PC, a Core Ultra 7 255H mini PC, an Intel NUC 13 Pro with Core i7-1360P, an Intel N100 mini PC, and two desktop systems powered by Intel Core i5-10400 and Core i5-12400 processors.
The Bosgame M6 has the AMD Ryzen AI 9 HX 370 processor, 12 cores / 24 threads, integrated AMD Radeon 890M graphics. The Bosgame M4 Plus has the AMD Ryzen 9 7940HS processor, 8 cores / 16 threads, integrated AMD Radeon 780M graphics. Both these machines are using 32GB DDR5 5600MHz RAM, and a 1TB NVMe.
The Intel N100 machine is included as a useful low-cost baseline. It shows what an inexpensive mini PC can deliver, making it easier to judge how much extra performance the higher-specification systems provide and whether that additional speed, responsiveness, and headroom justify their higher price for your workloads.
Each system is tested with the same software stack and configured as consistently as possible to ensure fair comparisons. Power management features are disabled during benchmarking, and where the BIOS offers a Power Limit mode, Performance Mode is selected. I also apply every reasonable performance-enhancing measure: the performance governor is used for all tests, background processes are kept to a minimum, and no Wayland session is running except where required for graphics benchmarks.
Let’s start with benchmarks that focus squarely on processor performance.
$ phoronix-test-suite benchmark smallpt
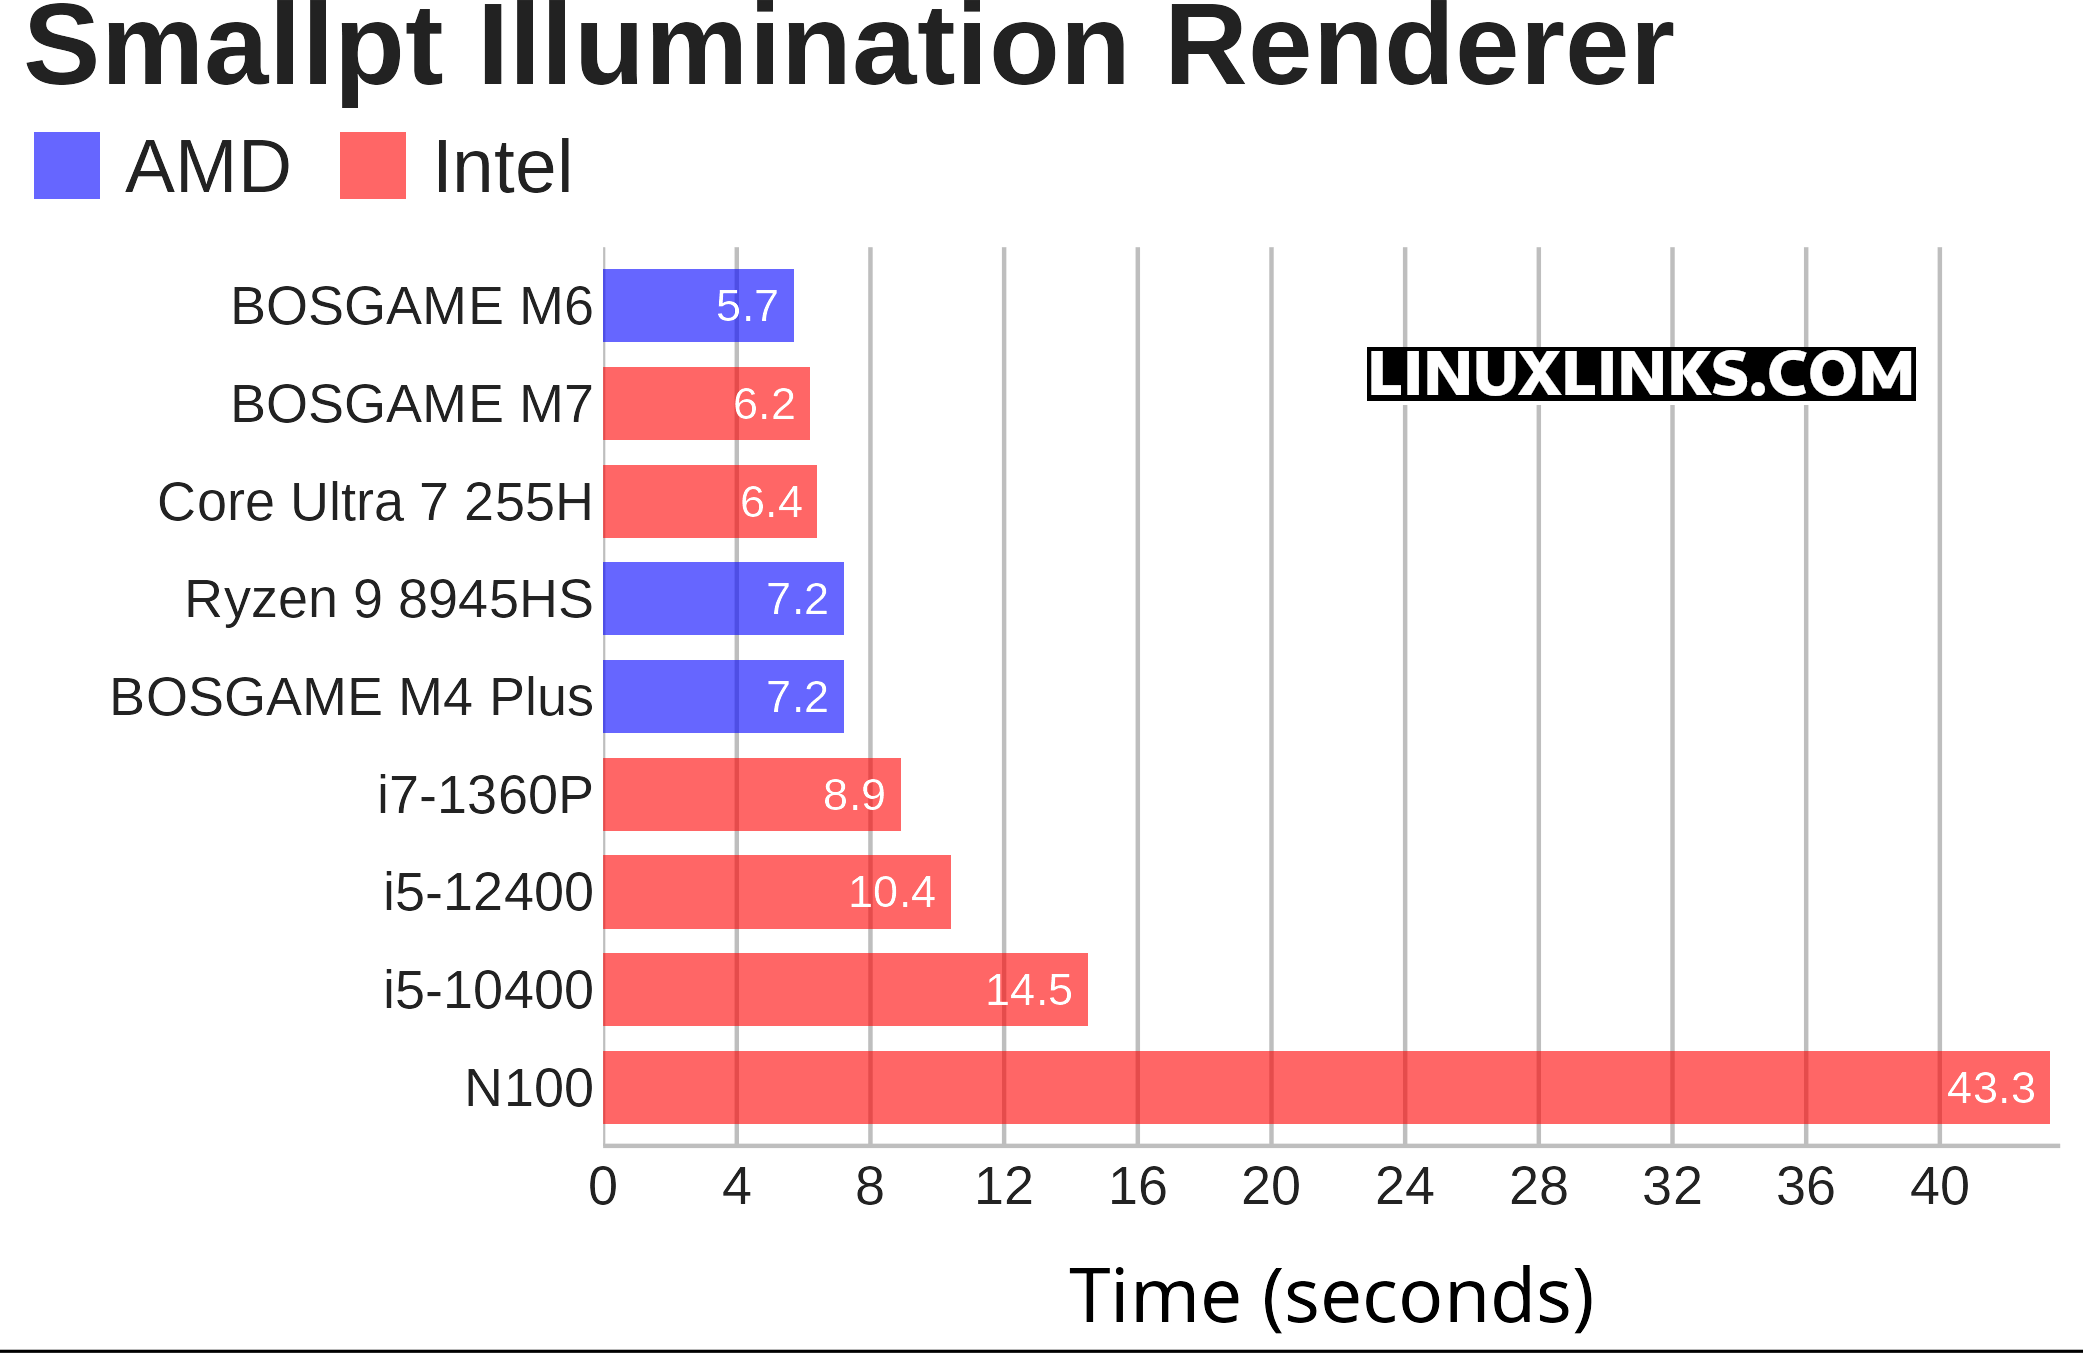
Smallpt is a C++ global illumination renderer written in less than 100 lines of code. Global illumination is done via unbiased Monte Carlo path tracing and there is multi-threading support via the OpenMP library. As this benchmark uses all cores, a CPU with many cores complete the test considerably quicker.
In this CPU rendering benchmark, lower is better. The Bosgame M7 completes the workload in 6.2 seconds, placing it near the top of the group.
It’s only narrowly behind the Bosgame M6, which leads the chart at 5.7 seconds, and it edges ahead of the Core Ultra 7 255H system. The M7 is also around 14% faster than the Ryzen 9 8945HS and Bosgame M4 Plus, both of which finish in 7.2 seconds.
The gap widens significantly against older and lower-power systems. The M7 is much quicker than the Core i7-1360P, the desktop Core i5-12400 and Core i5-10400 systems, and it’s almost 7 times faster than the Intel N100 machine. Overall, this is a strong result for the M7, showing excellent CPU throughput for a compact Intel-based mini PC.
$ phoronix-test-suite benchmark compress-pbzip2
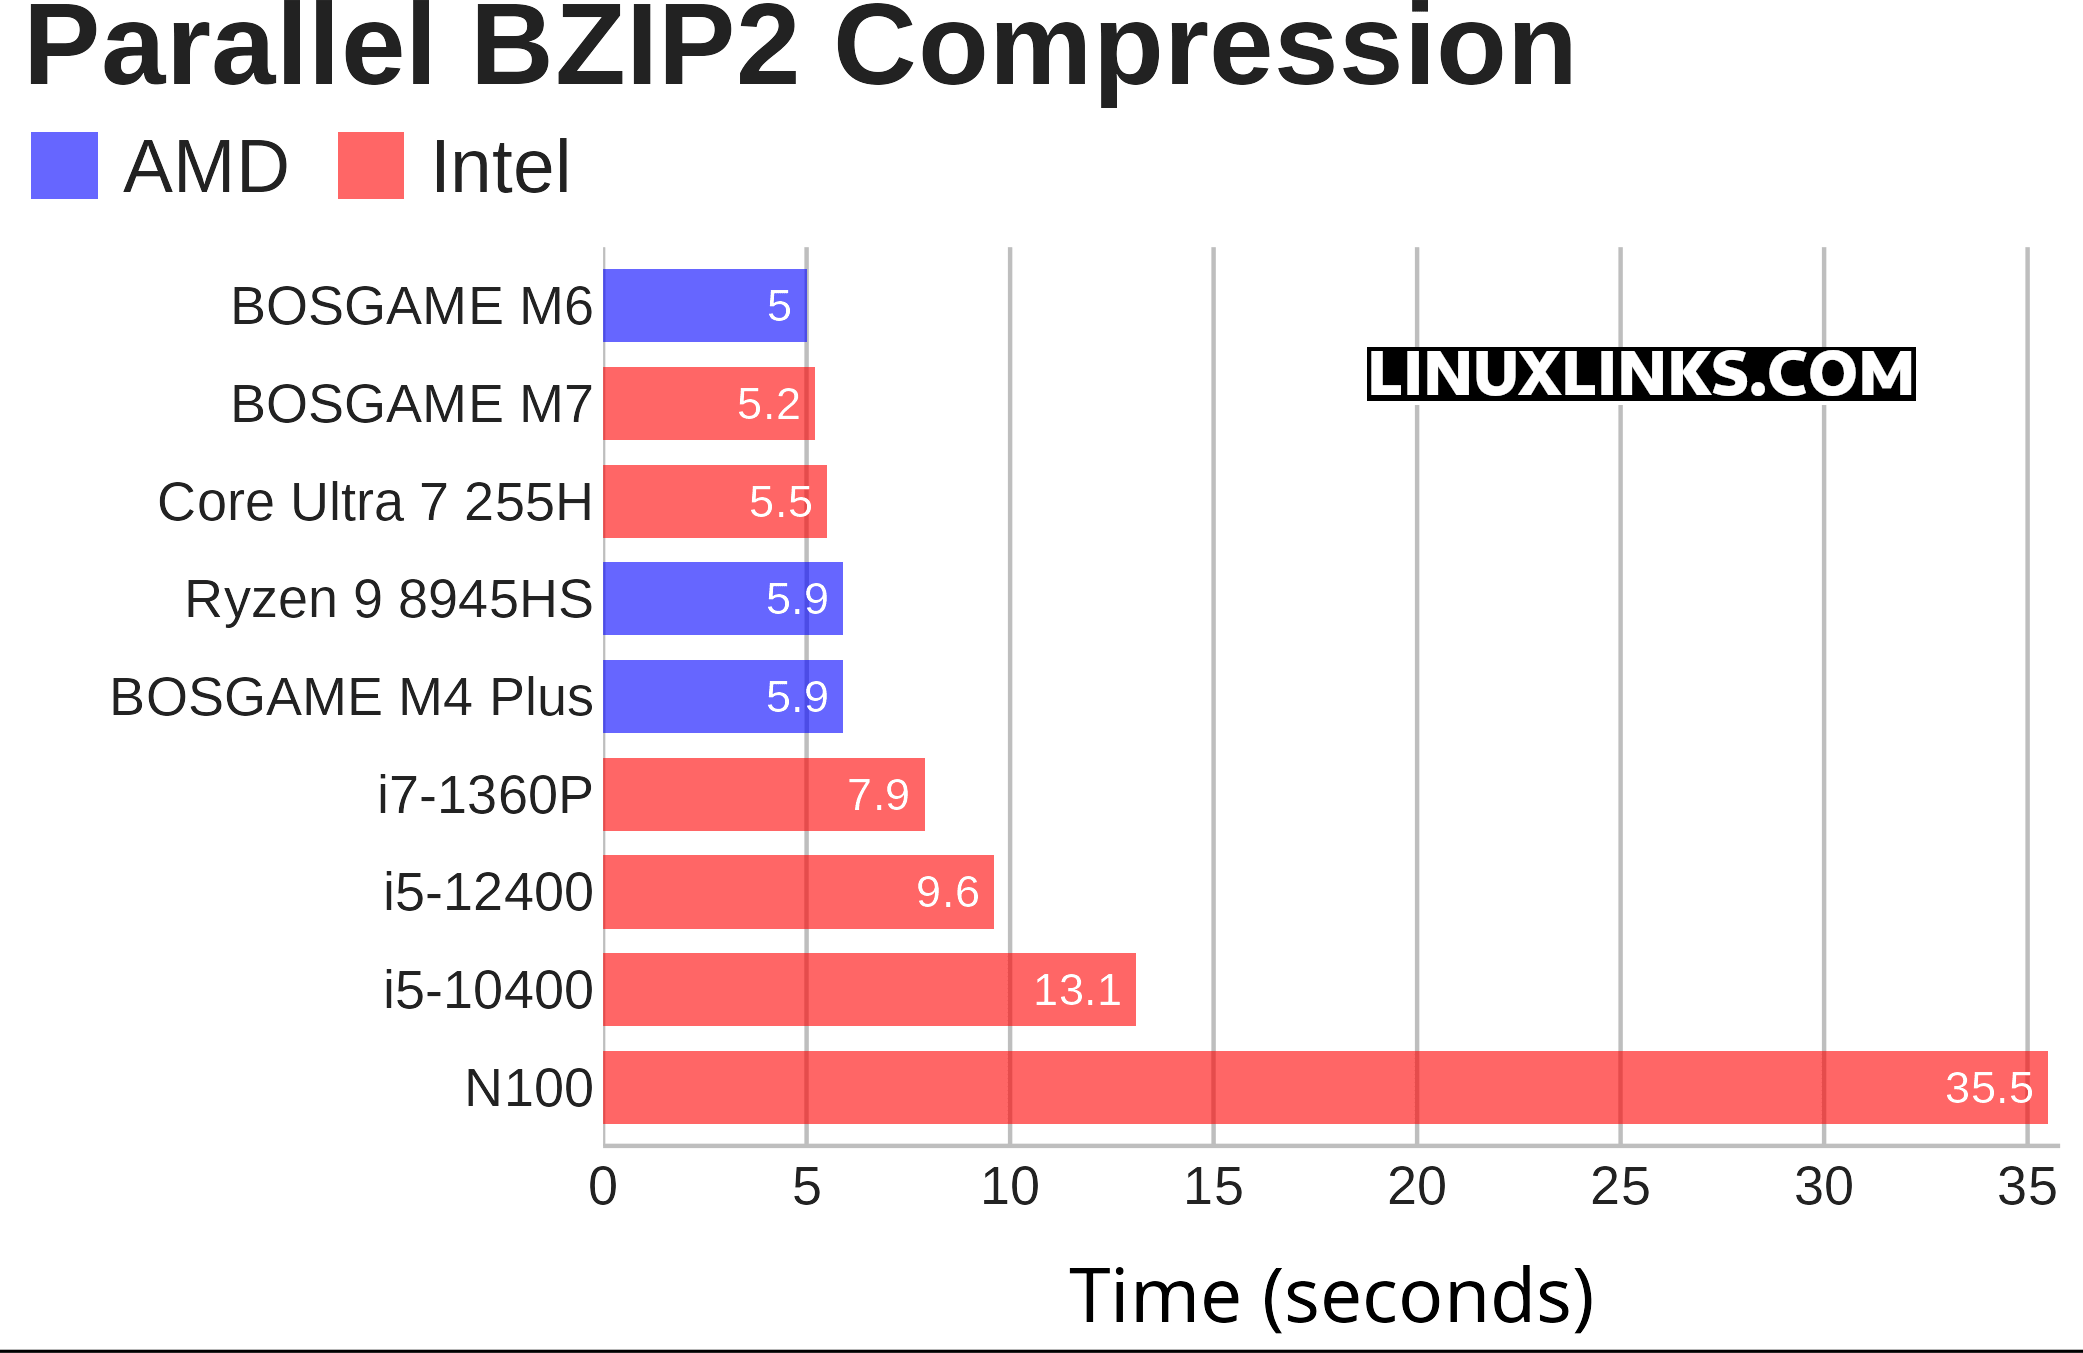
pbzip2 is a parallel implementation of the bzip2 block-sorting file compressor that uses pthreads and achieves near-linear speedup on SMP machines. This test measures the time needed to compress a file (a .tar package of the Linux kernel source code) using BZIP2 compression. Like the smallpt benchmark, this test uses all the cores.
The Parallel BZIP2 Compression benchmark broadly reinforces the pattern seen in Smallpt: the Bosgame M7 sits very close to the front of the pack.
The M7 completes the test in 5.2 seconds, just behind the Bosgame M6 at 5.0 seconds. That’s only a small gap, so in this heavily parallel compression workload the two Bosgame systems are effectively very closely matched, with the AMD Ryzen AI 9 HX 370 in the M6 retaining a slight edge.
The M7 again beats the Core Ultra 7 255H system, this time by around 6%, and it’s roughly 12% faster than the Ryzen 9 8945HS and Bosgame M4 Plus. That’s a strong result for the M7, especially as compression workloads tend to reward both CPU throughput and efficient multi-threaded scaling.
The advantage becomes much larger against the older Intel systems. The M7 is about 34% faster than the Core i7-1360P, 46% faster than the Core i5-12400 desktop, and around 60% faster than the Core i5-10400. Compared with the inexpensive N100 machine, the M7 is in a completely different class, finishing the workload almost 7 times faster.
Overall, this is another excellent showing for the Bosgame M7. As with Smallpt, it doesn’t quite catch the M6, but it remains one of the fastest systems tested and delivers a substantial uplift over the older Intel and budget mini PC platforms.
$ phoronix-test-suite benchmark openssl
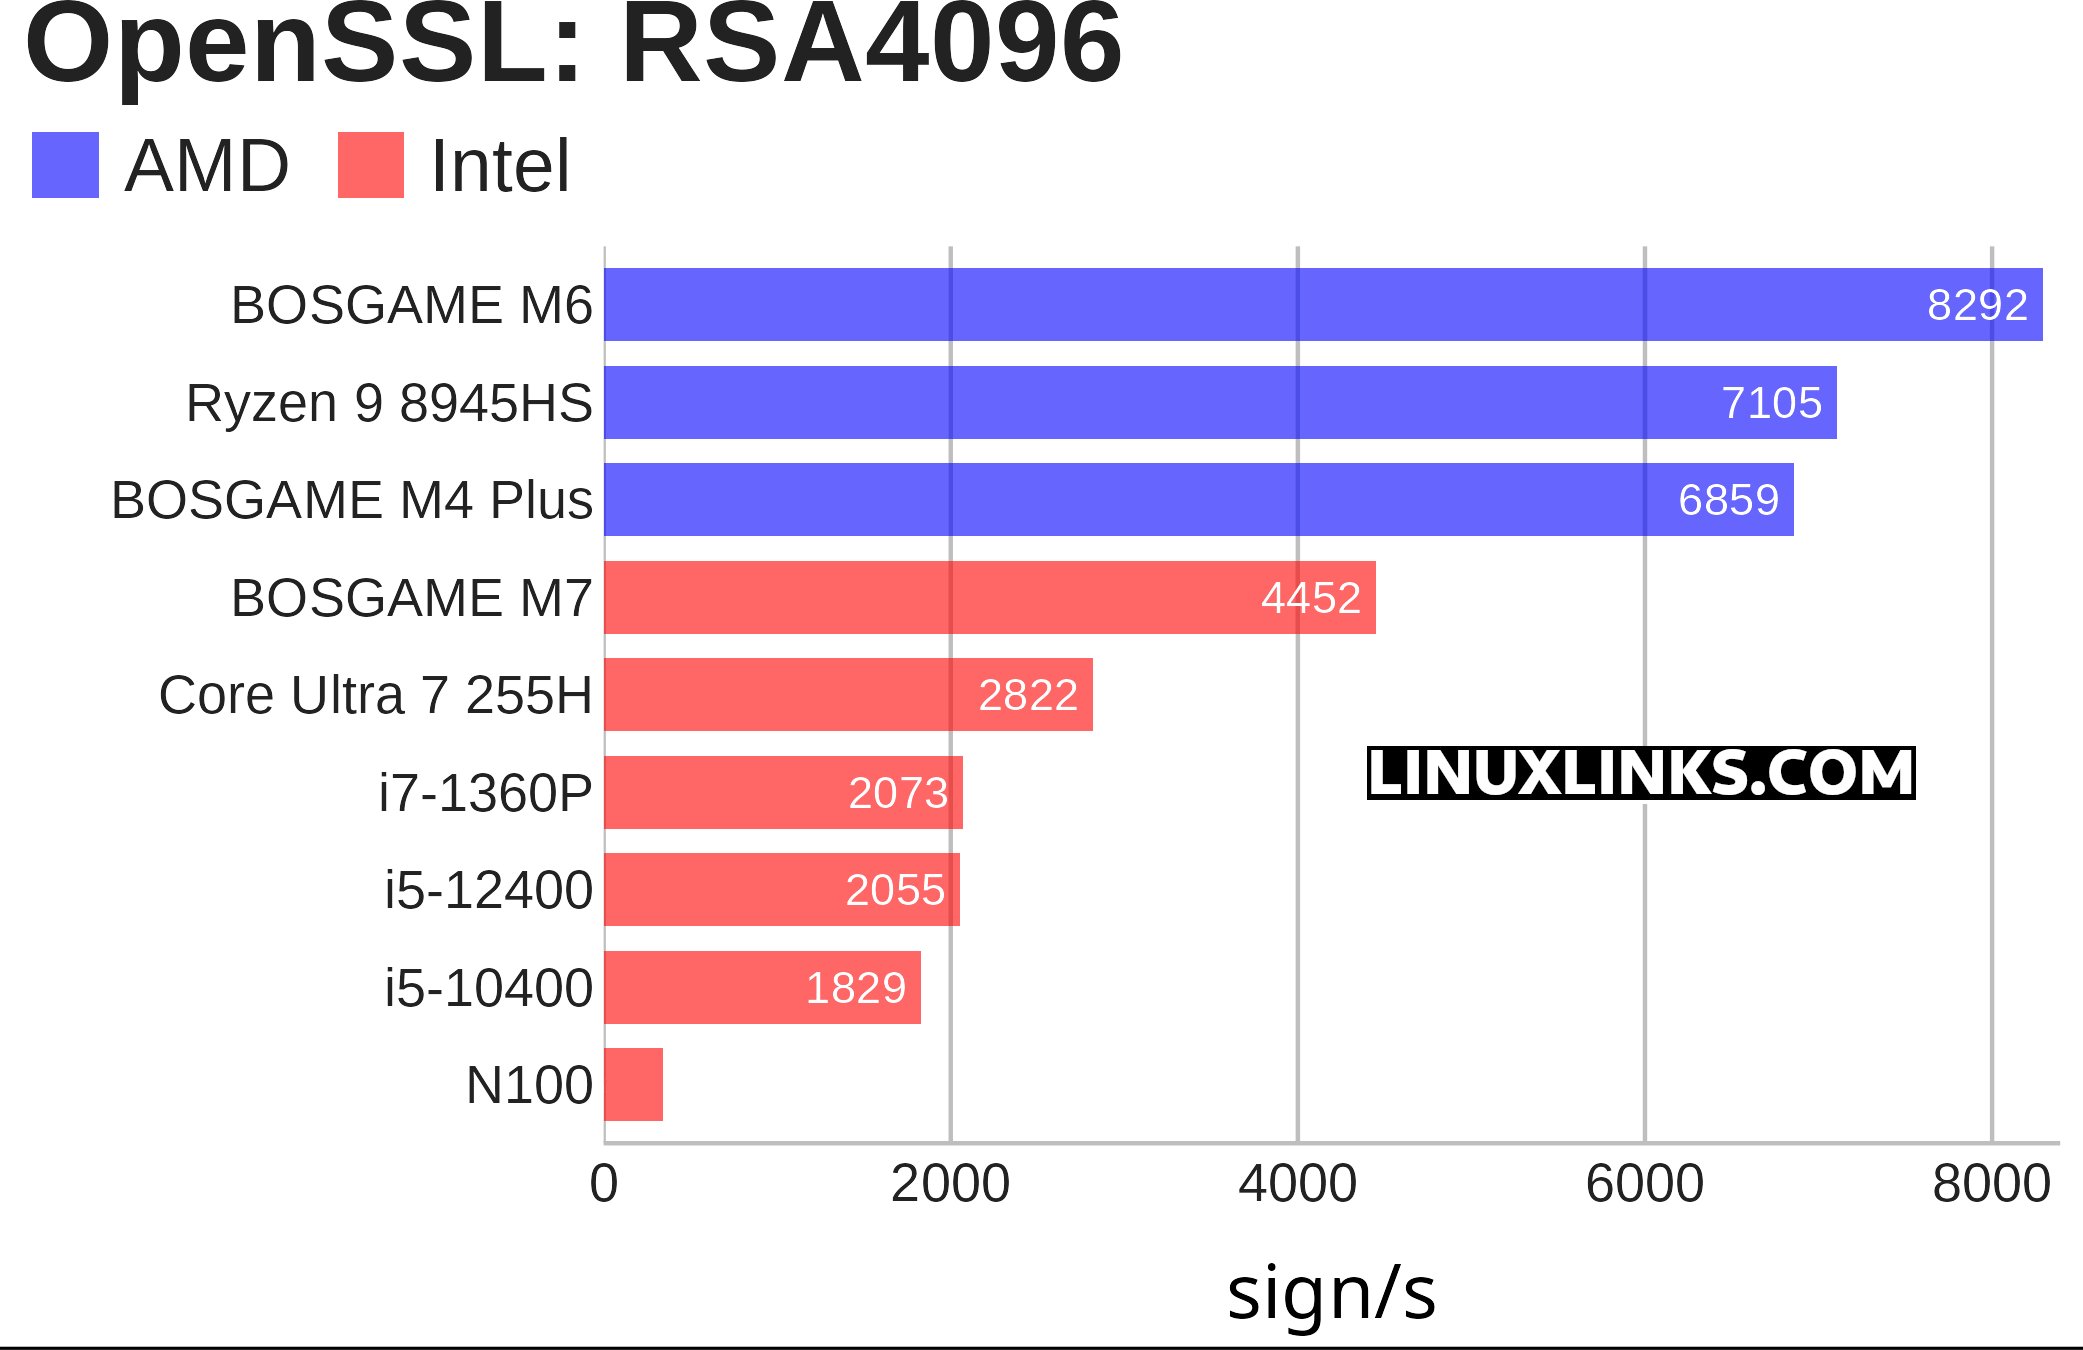
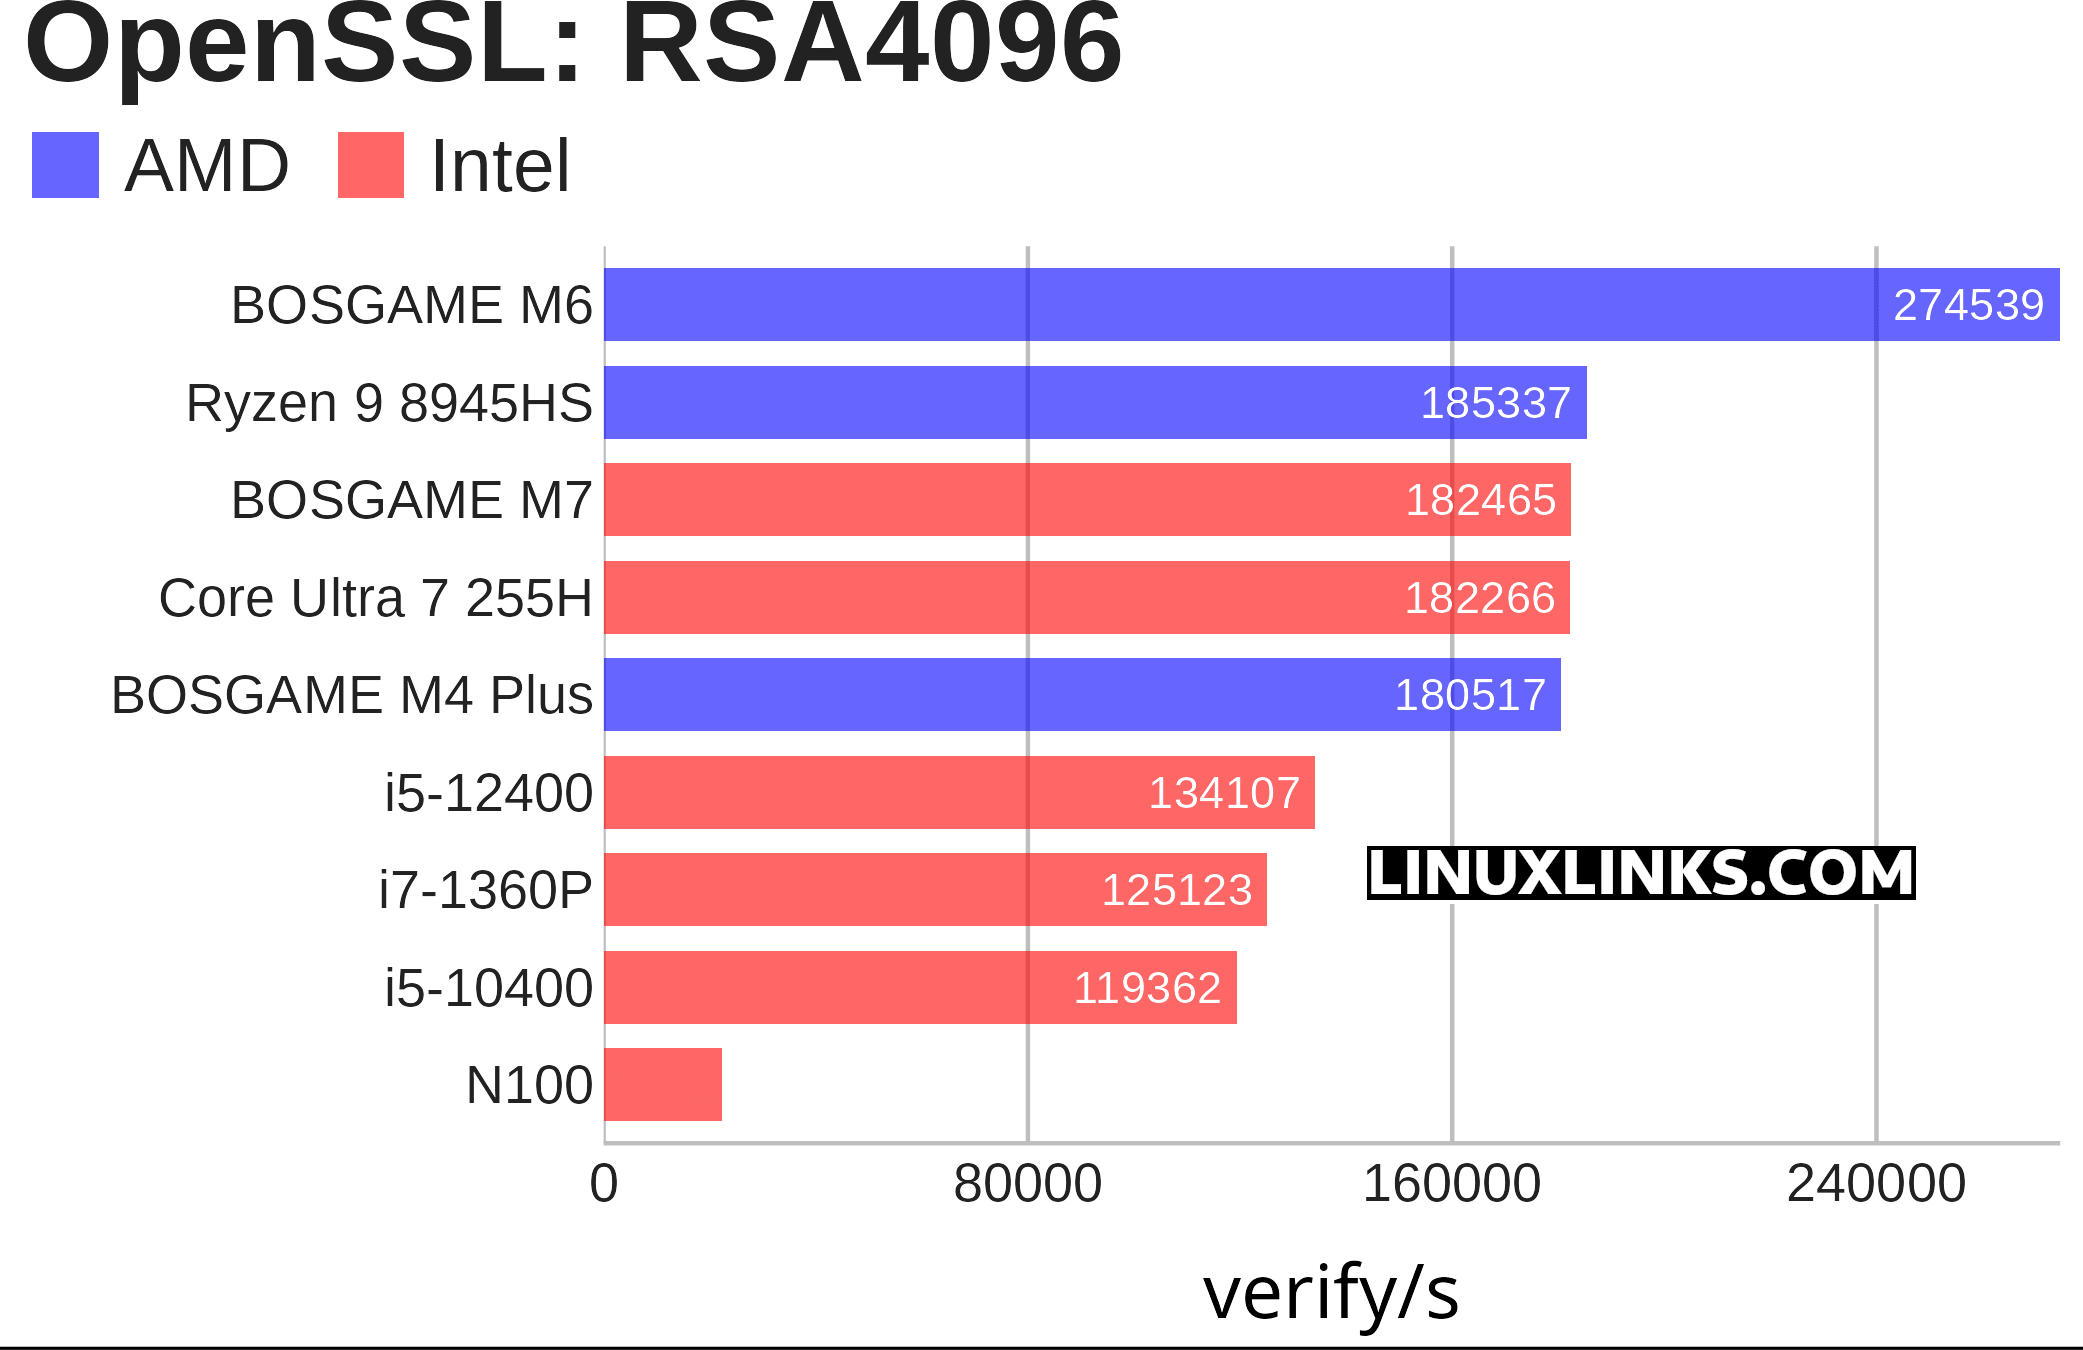
OpenSSL is an open-source toolkit that implements SSL (Secure Sockets Layer) and TLS (Transport Layer Security) protocols. This test profile makes use of the built-in “openssl speed” benchmarking capabilities.
There are various algorithms that can be used for this benchmark. I focused on the RSA4096 algorithm since it serves as a good representative for the other options. This benchmark includes two charts: one for signing speeds and another for verification speeds.
The M7 isn’t bad at RSA verification, but RSA4096 signing exposes the limits of Intel’s 285H hybrid core mix, lack of SMT, lower aggregate big-integer throughput, and possible sustained-power limits. The AMD CPUs provide stronger aggregate CPU resources for OpenSSL’s private-key RSA path, so they pull ahead sharply in sign/s.
$ phoronix-test-suite benchmark coremark
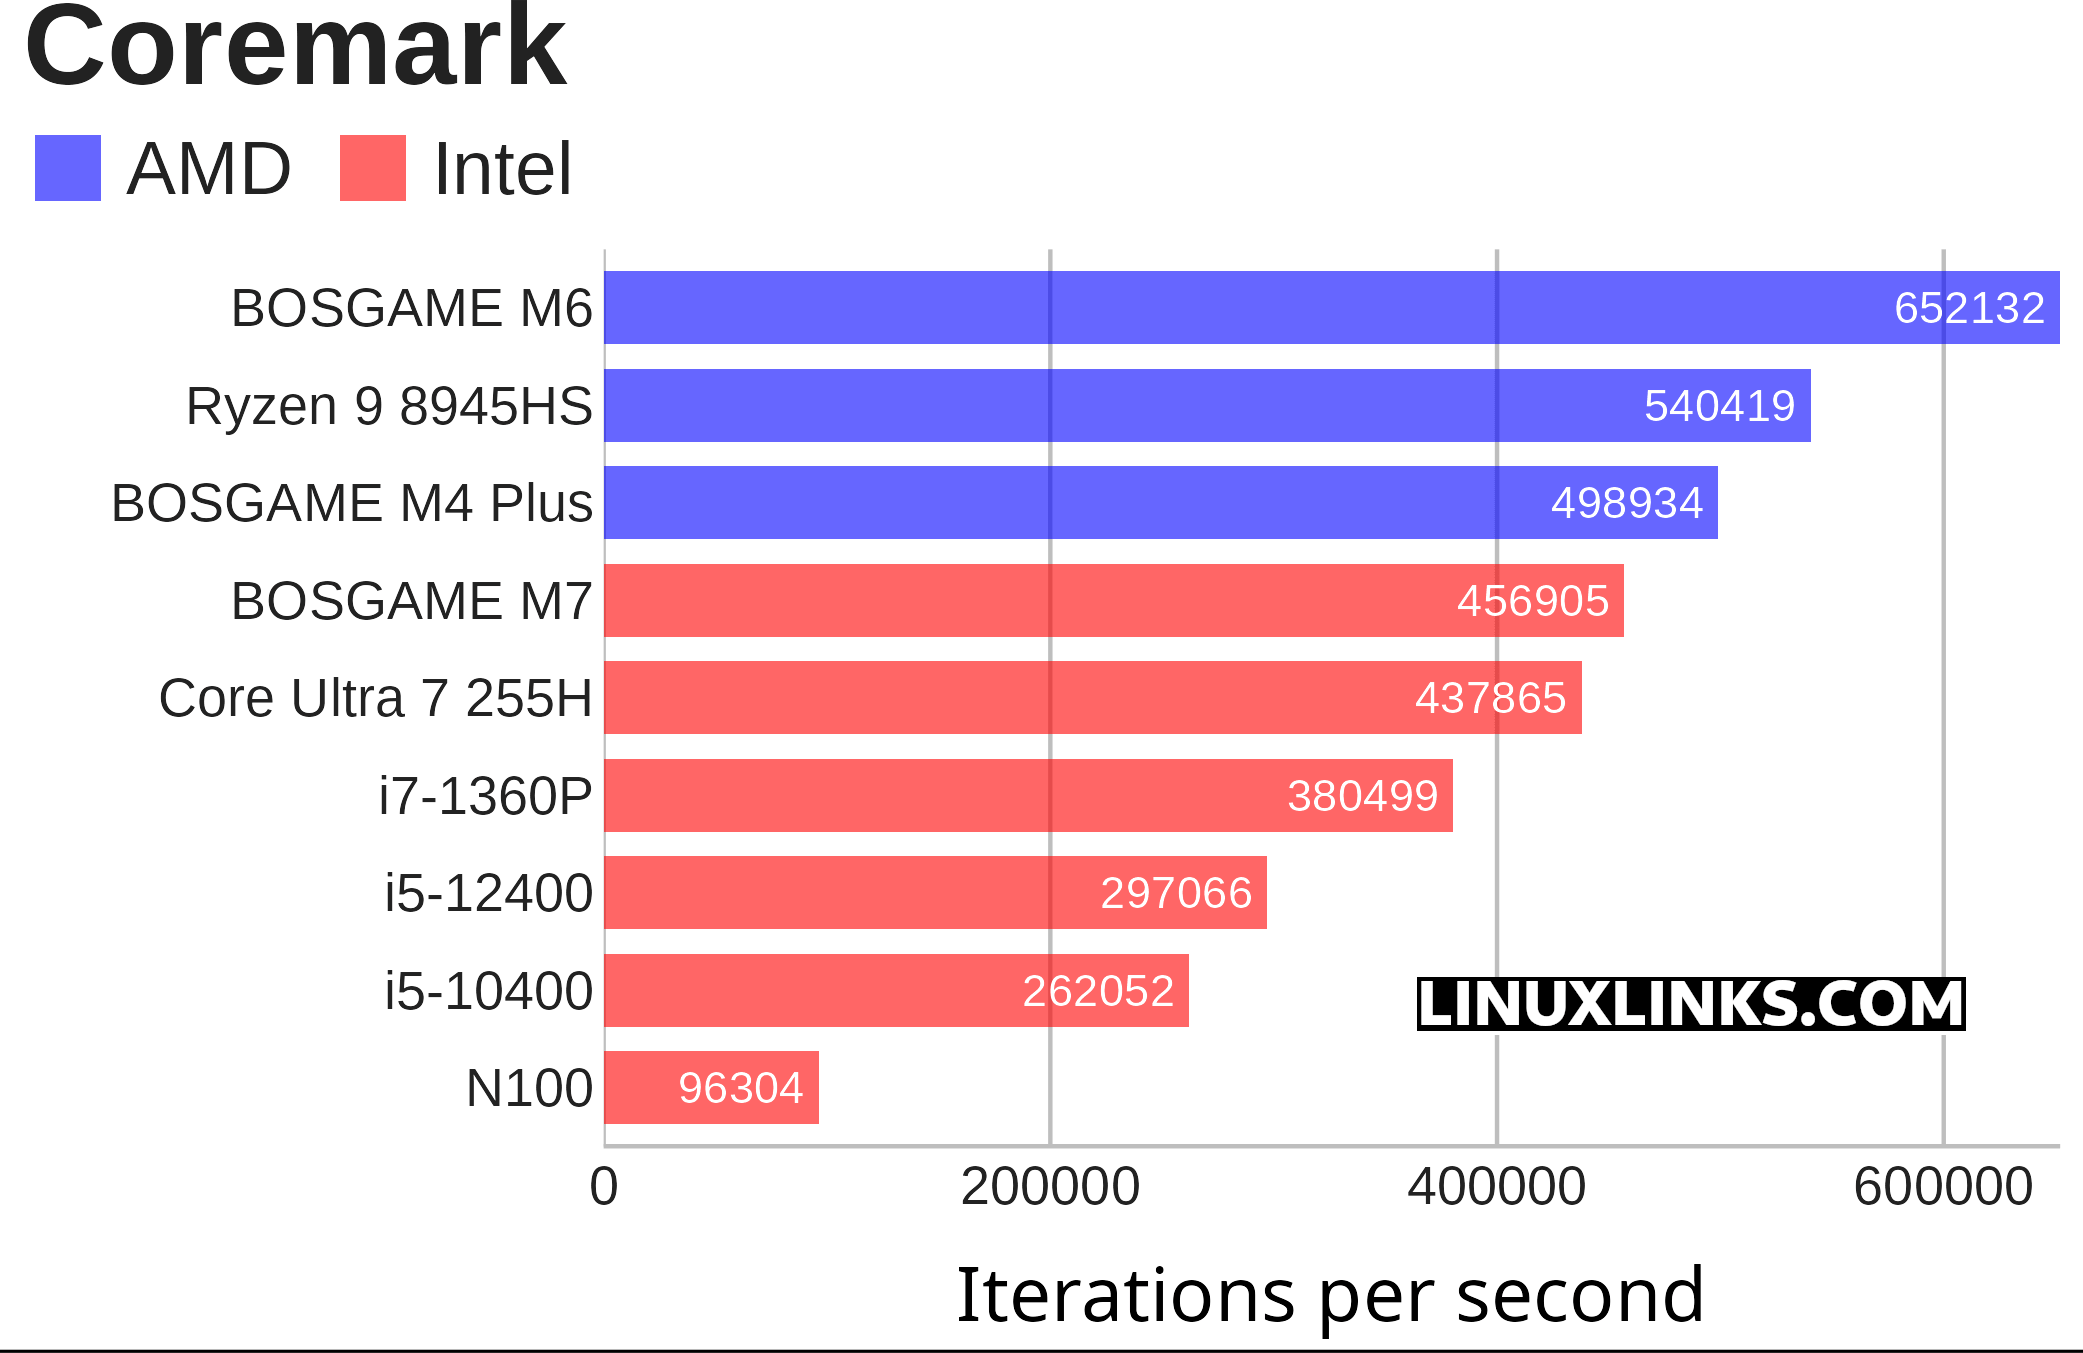
Coremark is a benchmark that measures the performance of central processing units (CPU) used in embedded systems. It’s built around list processing, matrix manipulation, state-machine logic, and CRC, so it mostly stresses integer execution, branches, cache behavior, compiler output, and how well the CPU sustains clocks under load.
The M7’s Core Ultra 9 285H has strong peak performance, but CoreMark favors sustained, balanced scalar integer throughput. The M7 is slightly more than 4% better than the Core Ultra 7 255H. It’s roughly what I’d expected as the Core Ultra 9 285H is essentially the higher-tier, higher-clocked version of the Core Ultra 7 255H.
$ phoronix-test-suite benchmark crafty
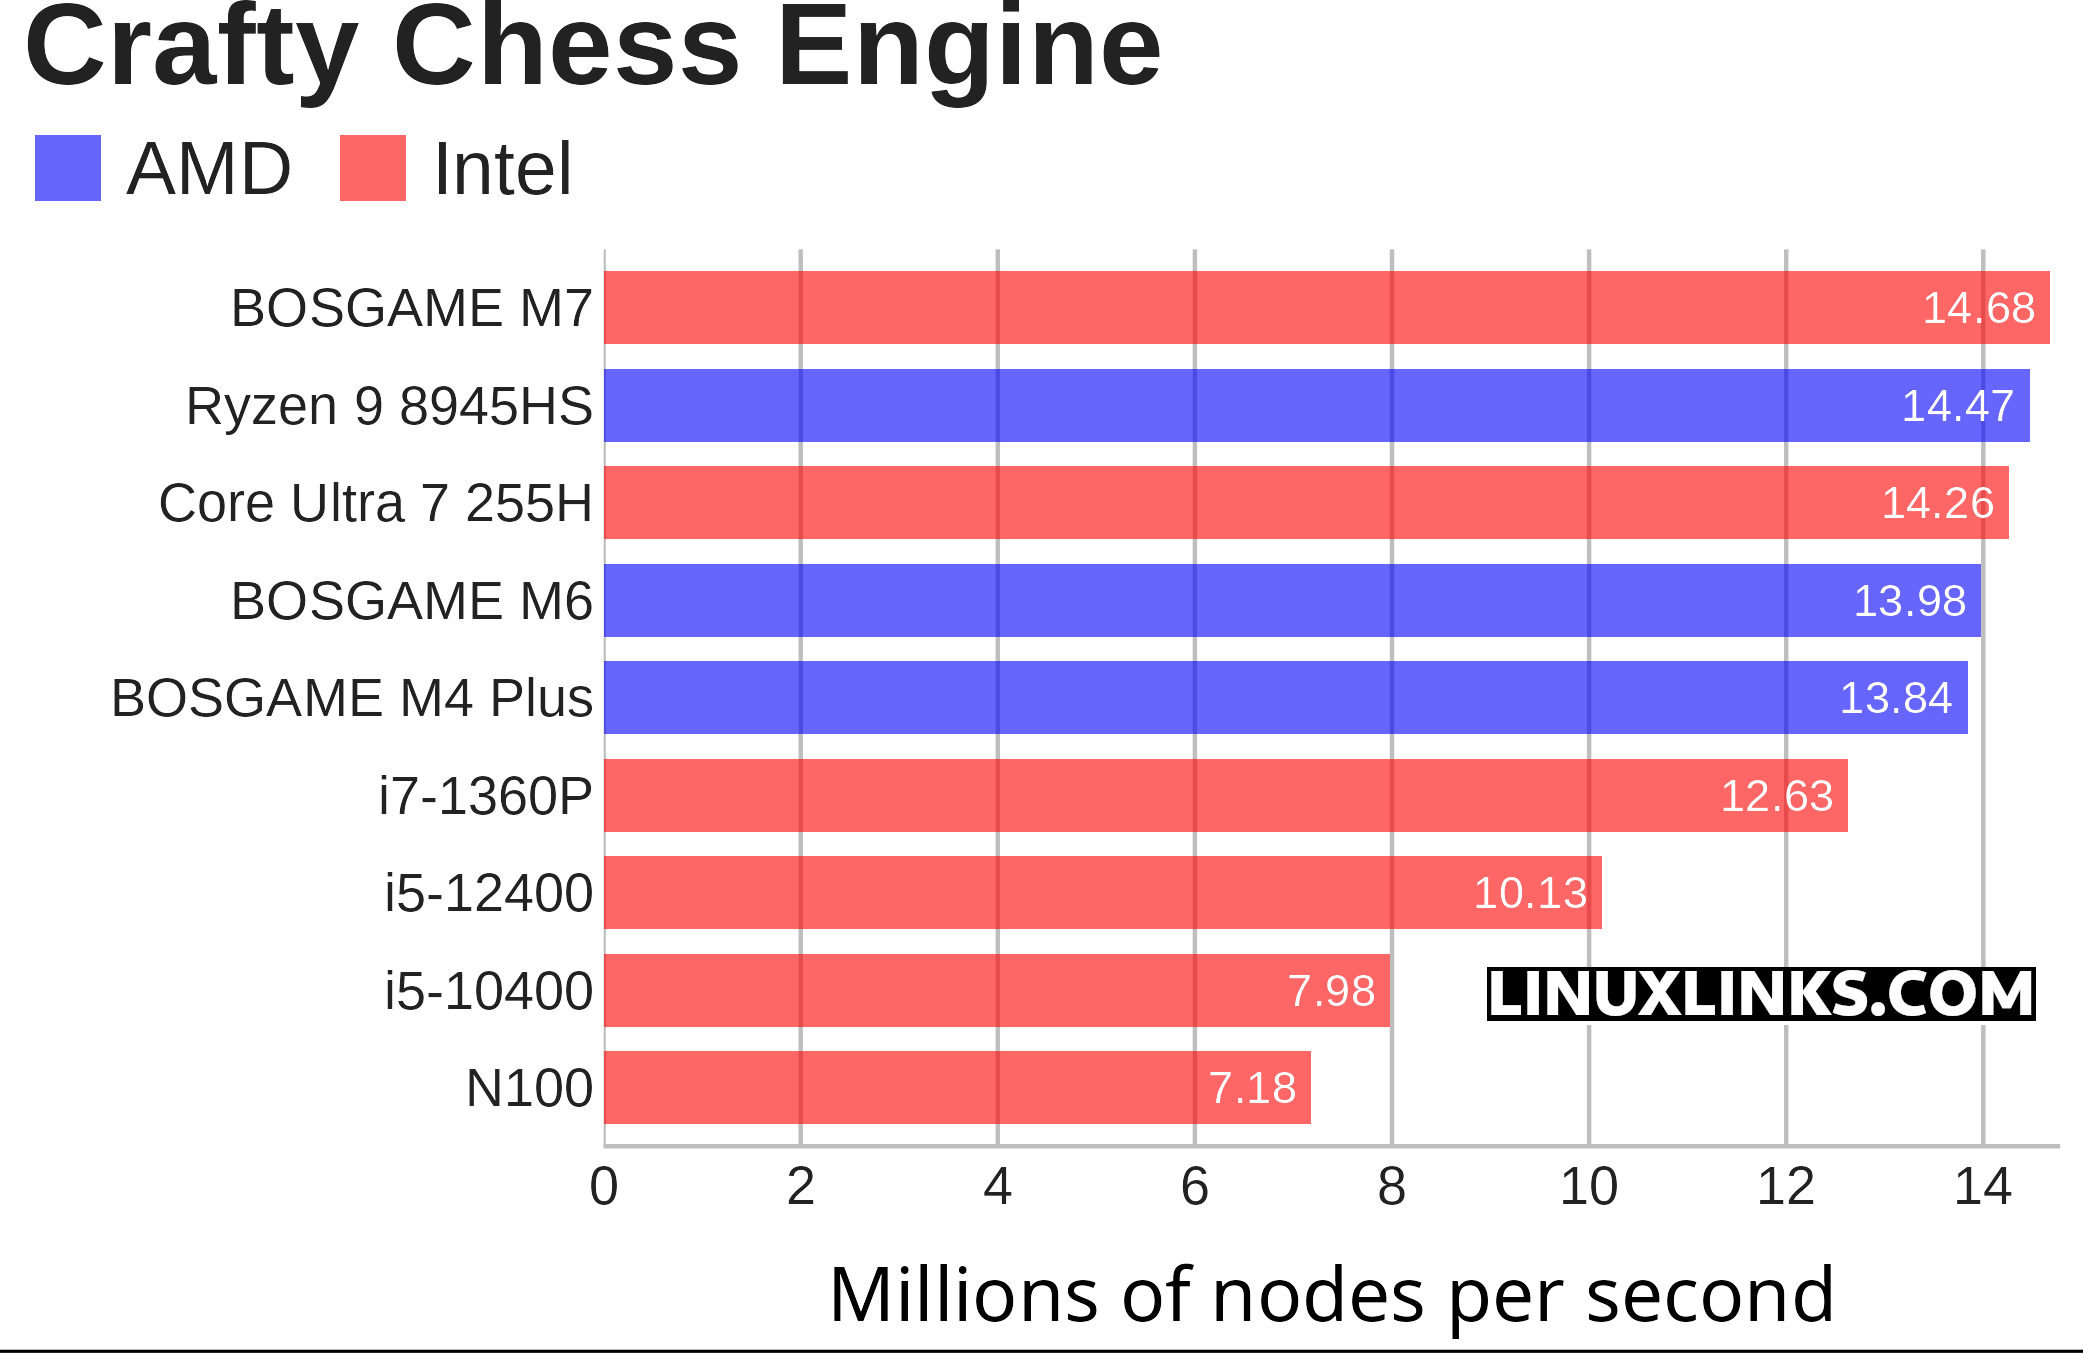
Crafty is a chess program directly derived from Cray Blitz, winner of the 1983 and 1986 World Computer Chess Championships. Crafty is a single-core benchmark, so the M7’s result reflects the strength of the Core Ultra 9 285H’s fastest P-core rather than the whole hybrid CPU. Chess-engine search is branch-heavy and latency-sensitive, relying on fast integer execution, cache behaviour, and high boost clocks. That lets the M7 edge ahead of the AMD systems. The margin is small, but it shows the 285H has very competitive single-threaded performance.
Single-threaded performance is important for desktop usage because many foreground tasks still depend on one fast core. App launches, browser responsiveness, UI interactions, scripting, document handling, and other short burst workloads are often limited by serial execution rather than total core count. That’s why the Bosgame M7’s strong Crafty result is relevant: it suggests the Core Ultra 9 285H has excellent single-core responsiveness, even though the AMD systems are stronger in several multi-threaded workloads.
Multi-core performance still matters, especially for video encoding, rendering, compiling large projects, compression, virtual machines, and heavy multitasking. But for ordinary desktop feel, single-threaded performance often has an outsized effect because it governs the speed of the foreground task the user is waiting on.
Pages in this article:
Page 1 – Introduction / Processor
Page 2 – Graphics
Page 3 – Memory
Page 4 – Disk / Summary
Complete list of articles in this series:
| Bosgame M7 Core Ultra 9 285H Mini PC | |
|---|---|
| Introduction | Introduction to the series and interrogation of the machine |
| Benchmarks | Benchmarking the Bosgame M7 Core Ultra 9 285H Mini PC |
| Power | Testing and comparing the power consumption |
| BIOS | In the world of computing, BIOS, which stands for Basic Input/Output System, plays a crucial role |
| Cores | Benchmarking the Bosgame M7’s Core Ultra 9 285H on Linux, comparing P-cores, E-cores and LP E-cores with Crafty, Coremark and smallpt. |
| Intel processors | P-Cores, E-Cores and LP E-Cores Compared Across 4 Intel Processors |
| More articles will be published next week | |