

Frappe Insights is a web-based business intelligence platform designed to make data exploration, reporting and visualization accessible to technical and non-technical users.
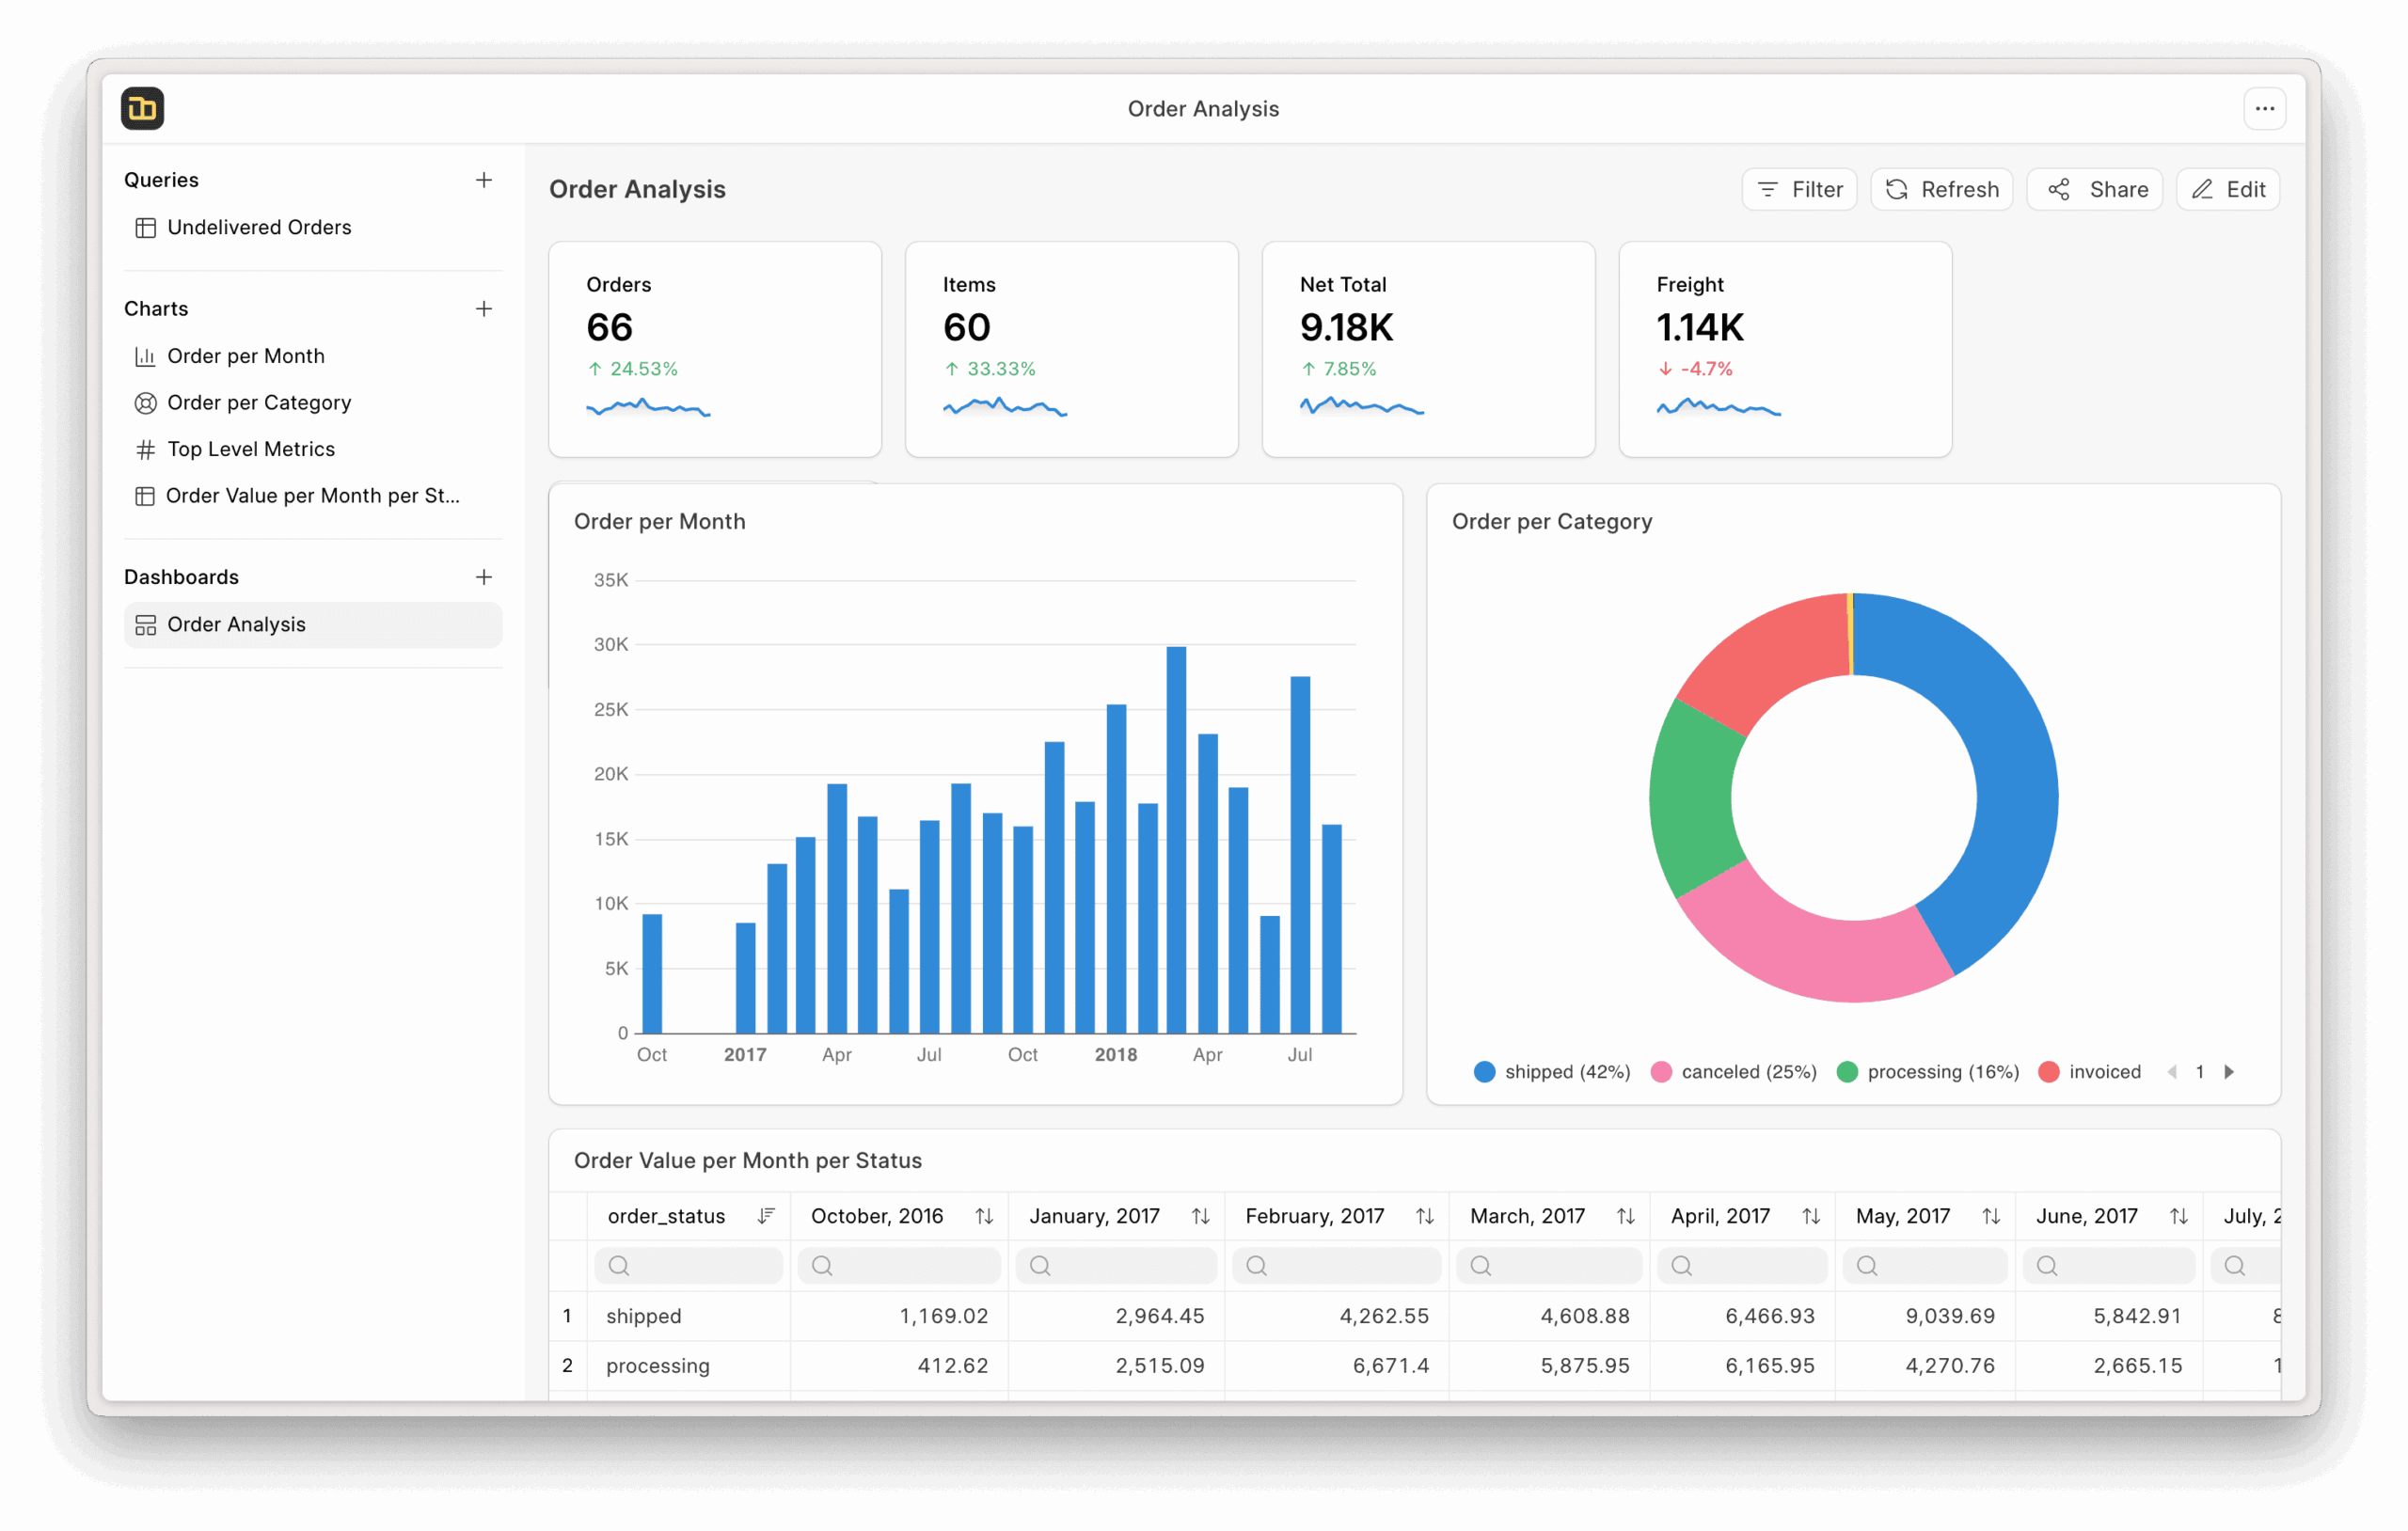
It connects to existing data sources and provides a visual workflow for turning raw tables into queries, charts and dashboards. The application is built on the Frappe Framework and combines a browser interface with a query layer capable of working across several database systems.
This is free and open source software.
Key Features
- Connects to multiple databases, files and spreadsheets so information from different sources can be analysed together.
- Provides a visual query builder which does not require users to write SQL.
- Build queries by selecting tables, adding joins, defining filters and creating calculated expressions.
- Creates interactive charts and graphs directly from query results.
- Offers chart suggestions based on the structure of the returned data.
- Build dashboards using a drag-and-drop interface with dashboard-level filters.
- Supports MySQL, PostgreSQL, DuckDB and BigQuery data sources.
- Uses Ibis as a query abstraction layer, allowing analytical operations to be expressed independently of the underlying database.
- Uses Apache ECharts for interactive data visualization.
- Integrates with the broader Frappe ecosystem and can be self-hosted alongside other Frappe applications.
- Separates data connection, querying and visualization workflows, making it suitable for exploratory analysis as well as recurring business reporting.
Website: github.com/frappe/insights
Support:
Developer: Frappe Technologies
License: GNU Affero General Public License v3.0
Frappe Insights is written in Python and TypeScript. Learn Python with our recommended free books and free tutorials. Learn TypeScript with our recommended free books and free tutorials.
Related Software
| Business Intelligence Software | |
|---|---|
| Metabase | Business intelligence and analytics software |
| Grafana | Platform for monitoring and observability |
| Superset | Data visualization and data exploration platform |
| Pentaho | Enterprise reporting, analysis, dashboard, data mining, workflow |
| Redash | Explore, query, visualize, and share data |
| Knowage | (formerly SpagoBI) Flexible business intelligence suite |
| ReportServer | Modern and versatile business intelligence platform |
| KNIME | Konstanz Information Miner |
| JasperReports | A widely used reporting engine |
| Rill | Operational BI tool |
| BIRT Project | Eclipse-based reporting system |
| Gephi | Visualization and exploration software for all kinds of graphs and networks |
| Lightdash | Looker alternative |
| evidence | Code-based alternative to drag-and-drop business intelligence tools |
| Briefer | Collaborative data workspace for teams |
| Shaper | SQL-first analytics and dashboard platform |
| RapidMiner | Data analysis, knowledge discovery, data mining, predictive analytics |
Read our verdict in the software roundup.
 Explore our carefully curated directory of recommended free and open source software, covering every major software category. Explore our carefully curated directory of recommended free and open source software, covering every major software category.The directory forms part of our extensive collection of articles for Linux enthusiasts. It includes hundreds of detailed reviews, together with free and open source alternatives to proprietary software from companies such as Google, Microsoft, Apple, Adobe, IBM, Cisco, Oracle, and Autodesk. LinuxLinks also covers interesting projects worth exploring, Linux-compatible hardware, free programming books and tutorials, and much more. Know a useful free and open source Linux application that we haven’t covered? Tell us about it using our submission form. |
Please read our Comment Policy before commenting.