

Grafana is a platform for querying, visualising, and analysing metrics, logs, traces, and other operational data.
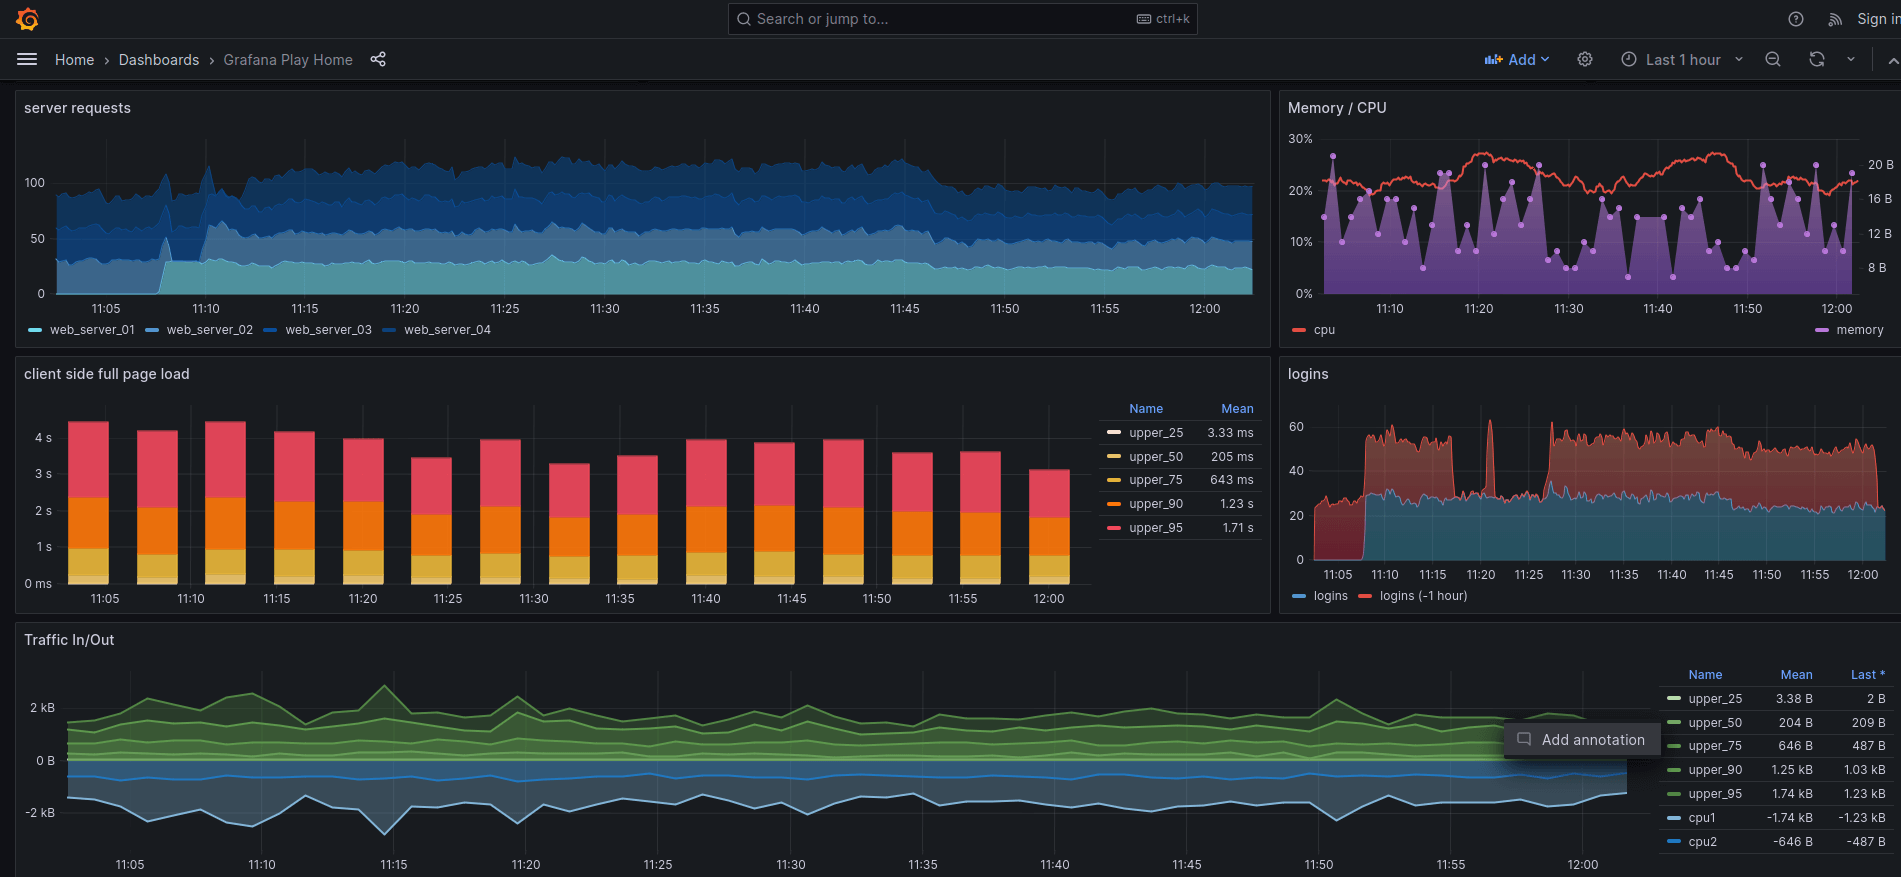
Rather than requiring organisations to move everything into a single datastore, Grafana can query many existing systems through its data-source architecture. Information from different sources can be combined in dashboards, while Explore provides an ad-hoc environment for investigating telemetry without first creating a permanent dashboard.
Grafana also includes alerting, dashboard variables, transformations, annotations, provisioning, and an extensive plugin ecosystem. It is widely used as a visualisation layer for observability stacks and can bring different telemetry signals together during troubleshooting and analysis.
This is free and open source software.
Key Features
- Flexible dashboards with a broad range of visualisation panels.
- Supports metrics, logs, traces, databases, and many other data sources.
- Explore interface for ad-hoc querying and investigation.
- Mix queries from multiple data sources within a dashboard.
- Dashboard variables for creating dynamic and reusable views.
- Transformations for reshaping and combining query results.
- Unified alerting for creating and evaluating alert rules.
- Flexible notification routing for alerts.
- Annotations for adding events and other context to visualisations.
- Provision dashboards and data sources from configuration files.
- Extensive ecosystem of data-source, panel, and application plugins.
- APIs for automation and integration with other systems.
Website: github.com/grafana/grafana
Support:
Developer: Grafana Labs
License: GNU Affero General Public License v3.0
Grafana is written in TypeScript and Go. Learn TypeScript with our recommended free books and free tutorials.
Related Software
| Business Intelligence Software | |
|---|---|
| Metabase | Business intelligence and analytics software |
| Grafana | Platform for monitoring and observability |
| Superset | Data visualization and data exploration platform |
| Redash | Explore, query, visualize, and share data |
| Knowage | (formerly SpagoBI) Flexible business intelligence suite |
| ReportServer | Modern and versatile business intelligence platform |
| Apache Zeppelin | Interactive notebooks for data analytics and visualisation |
| KNIME | Konstanz Information Miner |
| JasperReports | A widely used reporting engine |
| Rill | Operational BI tool |
| BIRT Project | Eclipse-based reporting system |
| Querybook | Collaborative SQL editor for querying and exploring large datasets |
| Lightdash | Looker alternative |
| evidence | Code-based alternative to drag-and-drop business intelligence tools |
| Shaper | SQL-first analytics and dashboard platform |
| Frappe Insights | Self-service business intelligence with interactive dashboards |
Read our verdict in the software roundup.
 LinuxLinks helps you discover the best free and open source software for Linux. Explore our extensive collection of recommended applications, including alternatives to popular proprietary software. We also publish software reviews, Linux tutorials, hardware reviews, free programming books and articles covering the wider open source community. Browse our Linux resources to discover more. Know a useful free and open source Linux application we haven't covered? Suggest a program for inclusion. Has your software been featured on LinuxLinks? Display one of our Featured on LinuxLinks badges on your website or GitHub README. |
Please read our Comment Policy before commenting.