

SynFlow is a web application for exploring alignments and structural differences between genomes. It works with output produced by SyRI, the Structural Rearrangement Identifier, and turns those results into interactive visualizations of synteny and genomic rearrangements.
The software is useful when comparing related genomes where a simple sequence-level browser does not clearly convey large-scale structural differences. Multiple comparisons can be chained together, allowing users to follow structural relationships through a series of genomes rather than being restricted to a single reference/query pair.
This is free and open source software.
Key Features
- Visualizes syntenic regions between genomes.
- Displays inversions, translocations, duplications and other structural rearrangements.
- Accepts output generated by SyRI.
- Supports chaining comparisons across multiple genomes.
- Can visualize chains containing up to 20 genomes.
- Allows chromosomes to be reordered with drag and drop.
- Provides zooming and panning for exploring large visualizations.
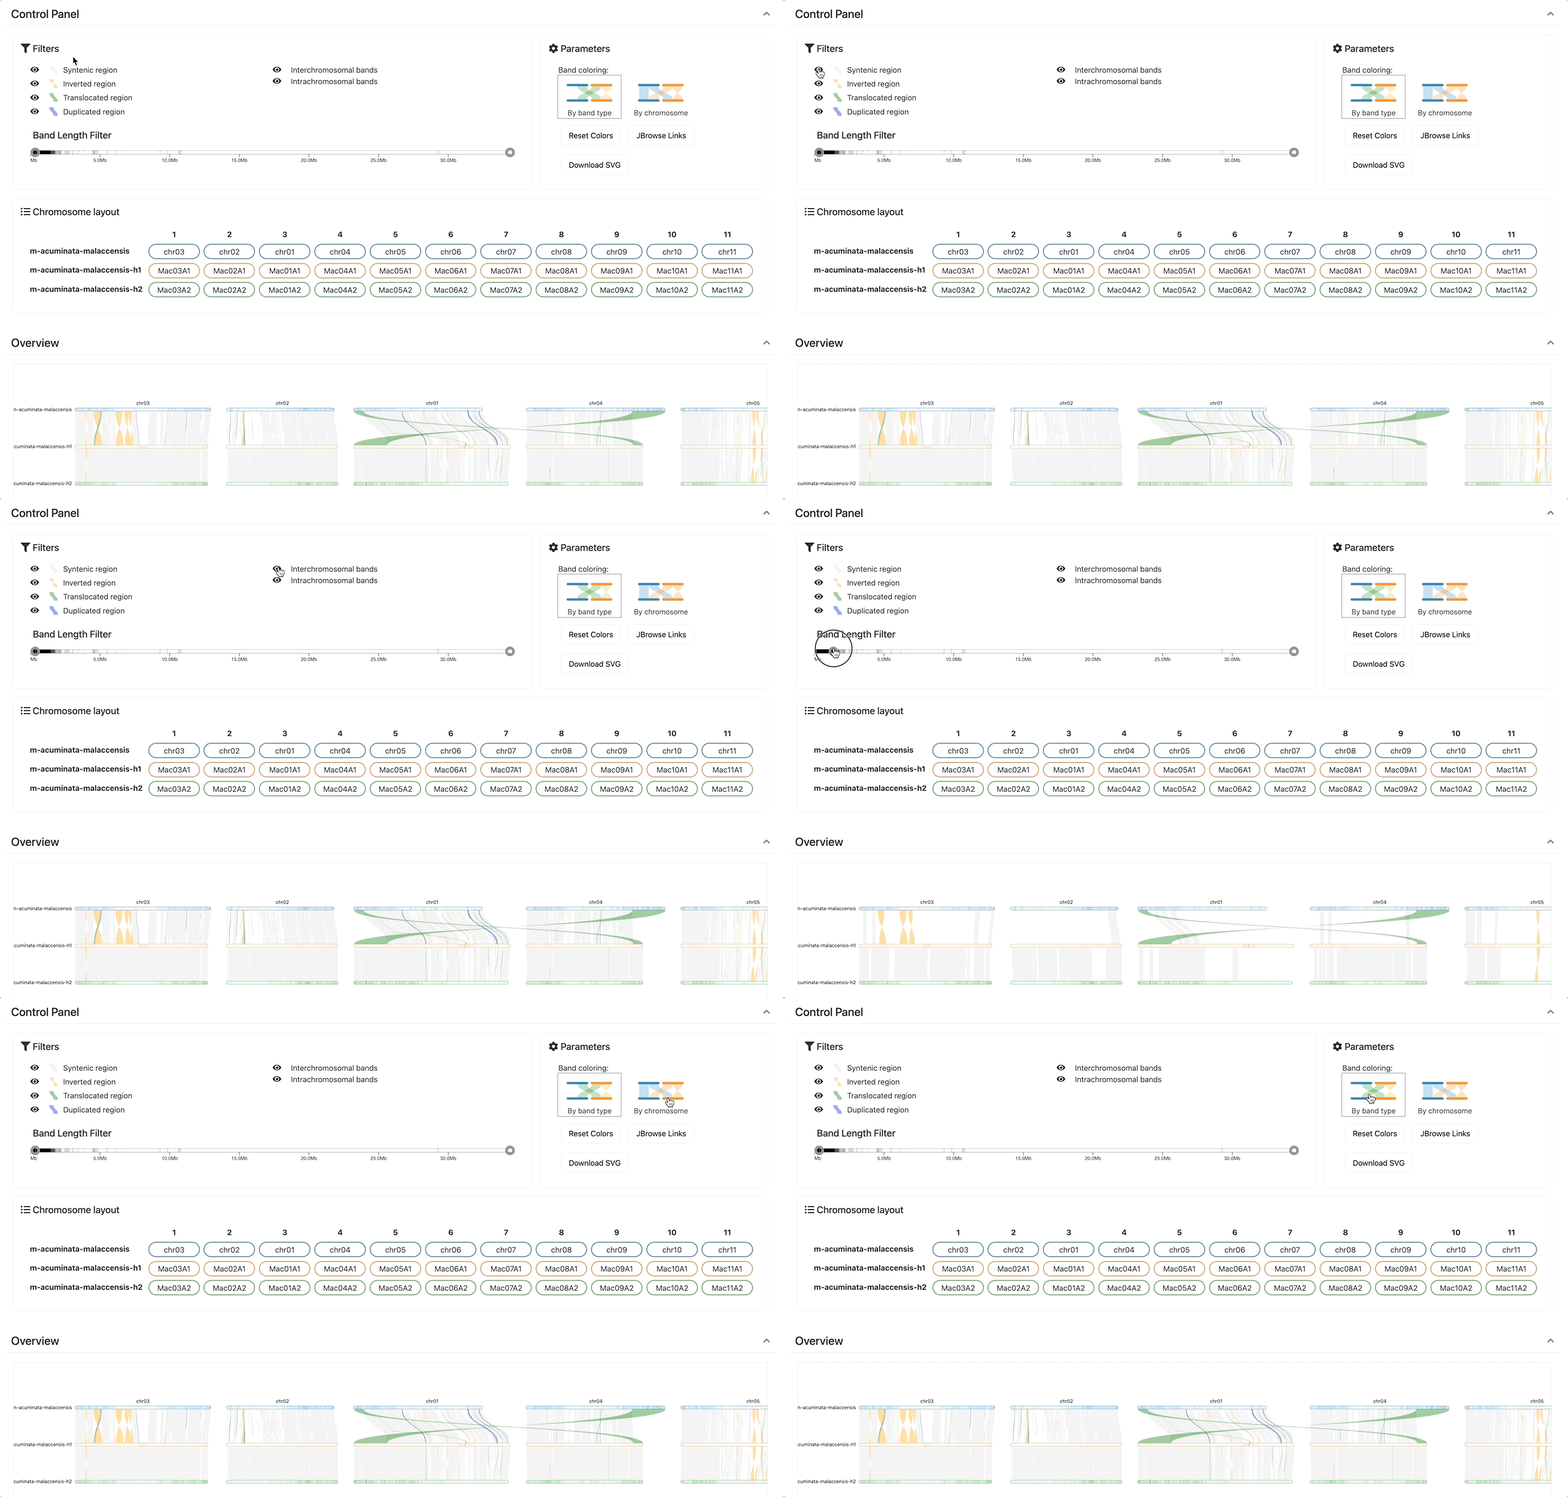
- Offers a control panel for adjusting visualization parameters.
- Supports filtering displayed bands using legends and sliders.
- Can use bundled precomputed datasets.
- Supports uploads of users’ own SyRI output files.
- Can import files directly from FTP servers.
- Can launch analysis from FASTA files with optional GFF3 annotation data.
- Exports visualizations in SVG format.
- Provides configurable heatmap colours and chromosome context controls.
- Includes a performance dashboard for examining rendering characteristics.
Website: github.com/SouthGreenPlatform/SynFlow
Support:
Developer: Marilyne Summo, Gaëtan Droc, Mathieu Rouard and Gautier Sarah
License: GNU General Public License v3.0
SynFlow is written in JavaScript. Learn JavaScript with our recommended free books and free tutorials.
Related Software
| Web-Based Desktop Genome Browsers | |
|---|---|
| Ensembl | Resource for geneticists, molecular biologists and other researchers |
| Genome Browser | Interactively visualize genomic data |
| GDV | Exploration and analysis of eukaryotic RefSeq genome assemblies |
| HiGlass | Explore and compare genomic contact matrices and tracks |
| igv.js | Embeddable genomic visualization |
| NGB | Web-based NGS data viewer |
| JBrowse 2 | Modern React-based genome browser |
| trackplot | Visualize various next-generation sequencing data |
| GIVE | Genomic Interactive Visualization Engine |
| Genoverse | HTML5 scrollable genome browser |
| Epigenome Browser | Visualization, integration and analysis tools for epigenomic datasets |
Read our verdict in the software roundup.
 Explore our carefully curated directory of recommended free and open source software, covering every major software category. Explore our carefully curated directory of recommended free and open source software, covering every major software category.The directory forms part of our extensive collection of articles for Linux enthusiasts. It includes hundreds of detailed reviews, together with free and open source alternatives to proprietary software from companies such as Google, Microsoft, Apple, Adobe, IBM, Cisco, Oracle, and Autodesk. LinuxLinks also covers interesting projects worth exploring, Linux-compatible hardware, free programming books and tutorials, and much more. Know a useful free and open source Linux application that we haven’t covered? Tell us about it using our submission form. |
Please read our Comment Policy before commenting.