

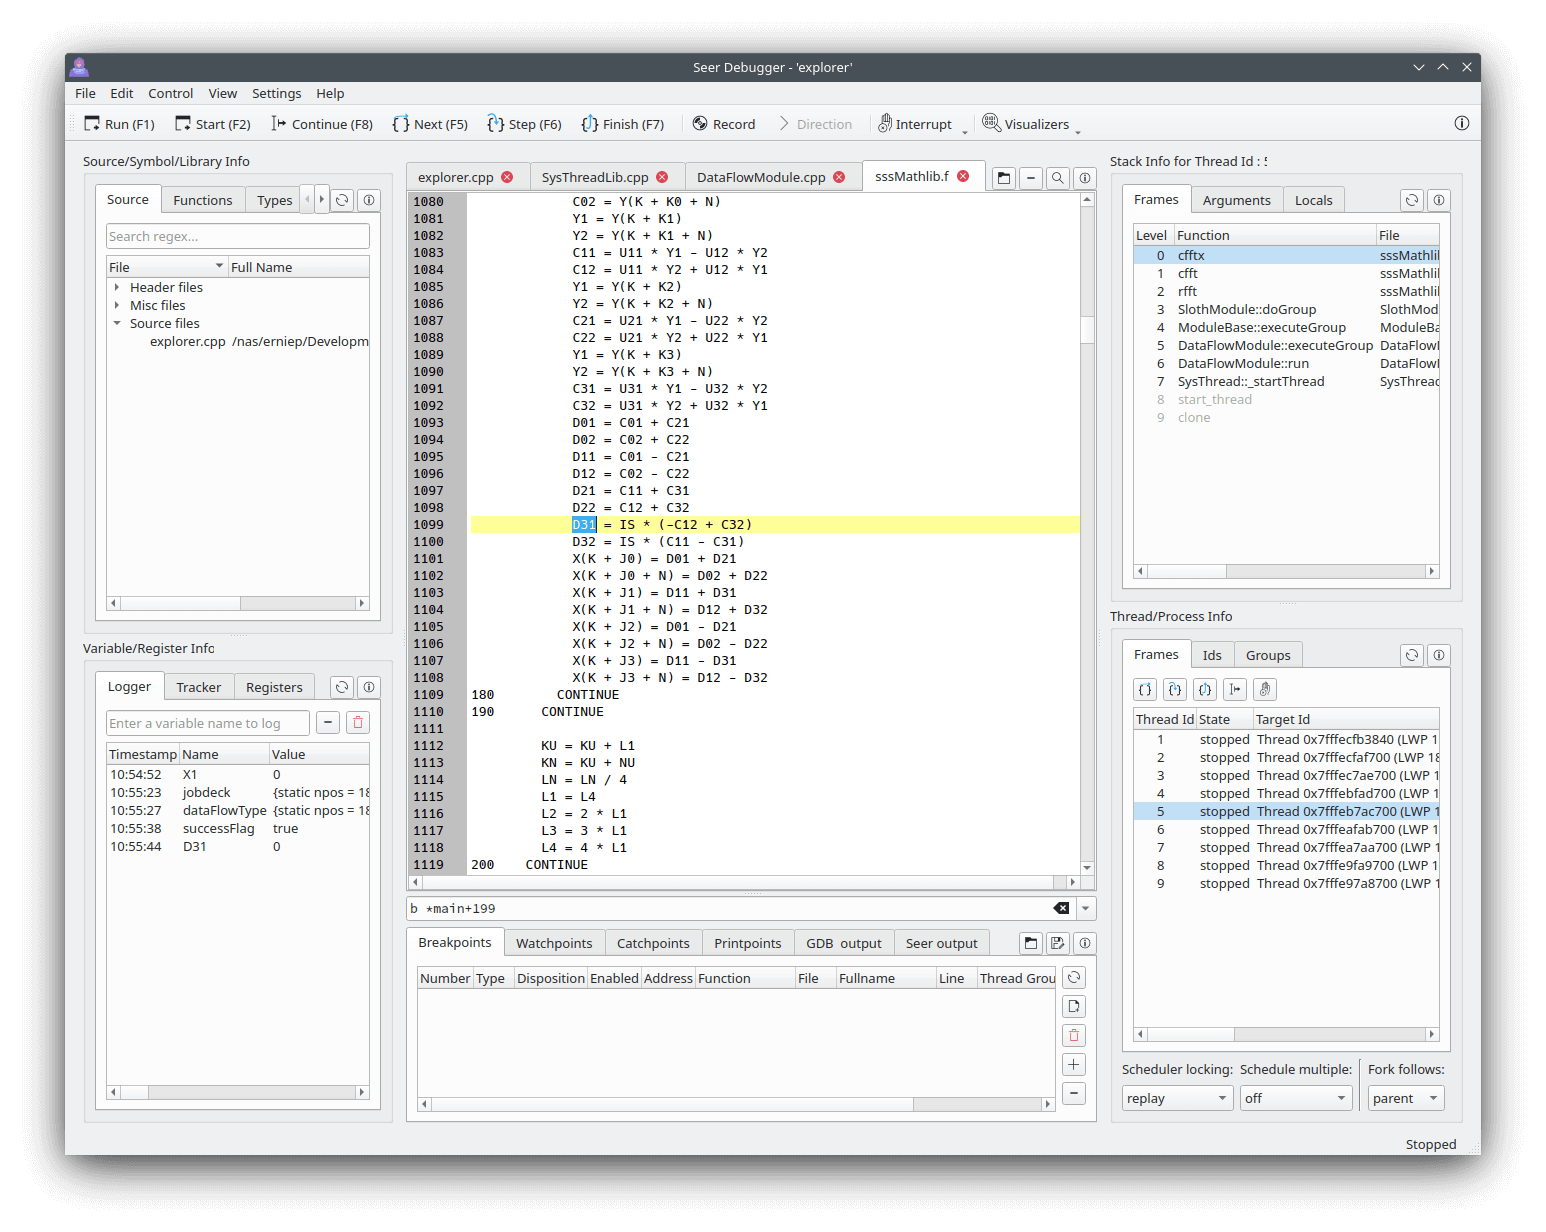
Seer is a graphical frontend to GDB, the GNU Debugger. It provides developers with a convenient way to investigate program execution without having to remember a large collection of debugger commands.
The interface brings together source code, variables, registers, stack frames and debugging controls in a collection of panels. Developers can navigate through a program, set breakpoints and examine changes in program state as execution progresses.
Seer also includes facilities for visualising memory and arrays, making it useful when investigating data structures or unexpected values. It communicates with GDB through its machine interface and uses the Qt toolkit.
This is free and open source software.
Key Features
- Display source files with syntax highlighting, searchable code and debugging controls.
- Set and manage breakpoints, conditional watchpoints, catchpoints and printpoints.
- Inspect local variables, CPU registers, stack frames and thread information.
- Track selected variables and monitor their values as program execution progresses.
- Examine raw memory and disassembly through a dedicated memory visualiser.
- Visualise arrays with graphical plots, including spline, scatter and X-Y representations.
- Display assembly instructions alongside source code and set instruction-level breakpoints.
- Support GDB’s reverse debugging facilities, including execution recording and playback direction.
- Enter GDB commands directly when functionality is not exposed through the graphical interface.
- Detach code and debugging panels to arrange the workspace across multiple windows.
Website: github.com/epasveer/seer
Support:
Developer: Ernie Pasveer
License: GNU General Public License v3.0
Seer is written in C++. Learn C++ with our recommended free books and free tutorials.
Related Software
| Debuggers | |
|---|---|
| LLDB | Next generation, high-performance debugger |
| Ghidra | Software reverse engineering framework |
| Delve | Source level debugger for the Go programming language |
| GDB | The GNU Debugger |
| Valgrind | A memory debugger and profiler |
| Radare2 | Portable reversing framework |
| BugStalker | Rust debugger |
| Xdebug | Extension for PHP to aid debugging and development |
| Seer | GUI frontend to GDB |
| iaito | Graphical interface for radare2 |
| React Native Debugger | Standalone app for debugging React Native apps |
| KDbg | Graphical user interface to GDB |
| strace | Diagnostic, debugging and instructional userspace utility |
| rr | Record-and-replay debugger |
| drgn | Programmable debugger that puts scripting at the centre |
| cgdb | Lightweight console frontend to the GNU debugger |
| PuDB | Console-based visual debugger for Python |
| nnd | Partially inspired by RemedyBG |
| bashdb | Source-code debugger for bash; follows the GDB command syntax |
| Sysprof | Profile an application or entire system |
| crash | Linux kernel crash analysis utility |
| Nemiver | Standalone graphical debugger for GNOME |
Read our verdict in the software roundup.
 Explore our carefully curated directory of recommended free and open source software, covering every major software category. Explore our carefully curated directory of recommended free and open source software, covering every major software category.The directory forms part of our extensive collection of articles for Linux enthusiasts. It includes hundreds of detailed reviews, together with free and open source alternatives to proprietary software from companies such as Google, Microsoft, Apple, Adobe, IBM, Cisco, Oracle, and Autodesk. LinuxLinks also covers interesting projects worth exploring, Linux-compatible hardware, free programming books and tutorials, and much more. Know a useful free and open source Linux application that we haven’t covered? Tell us about it using our submission form. |
Please read our Comment Policy before commenting.