
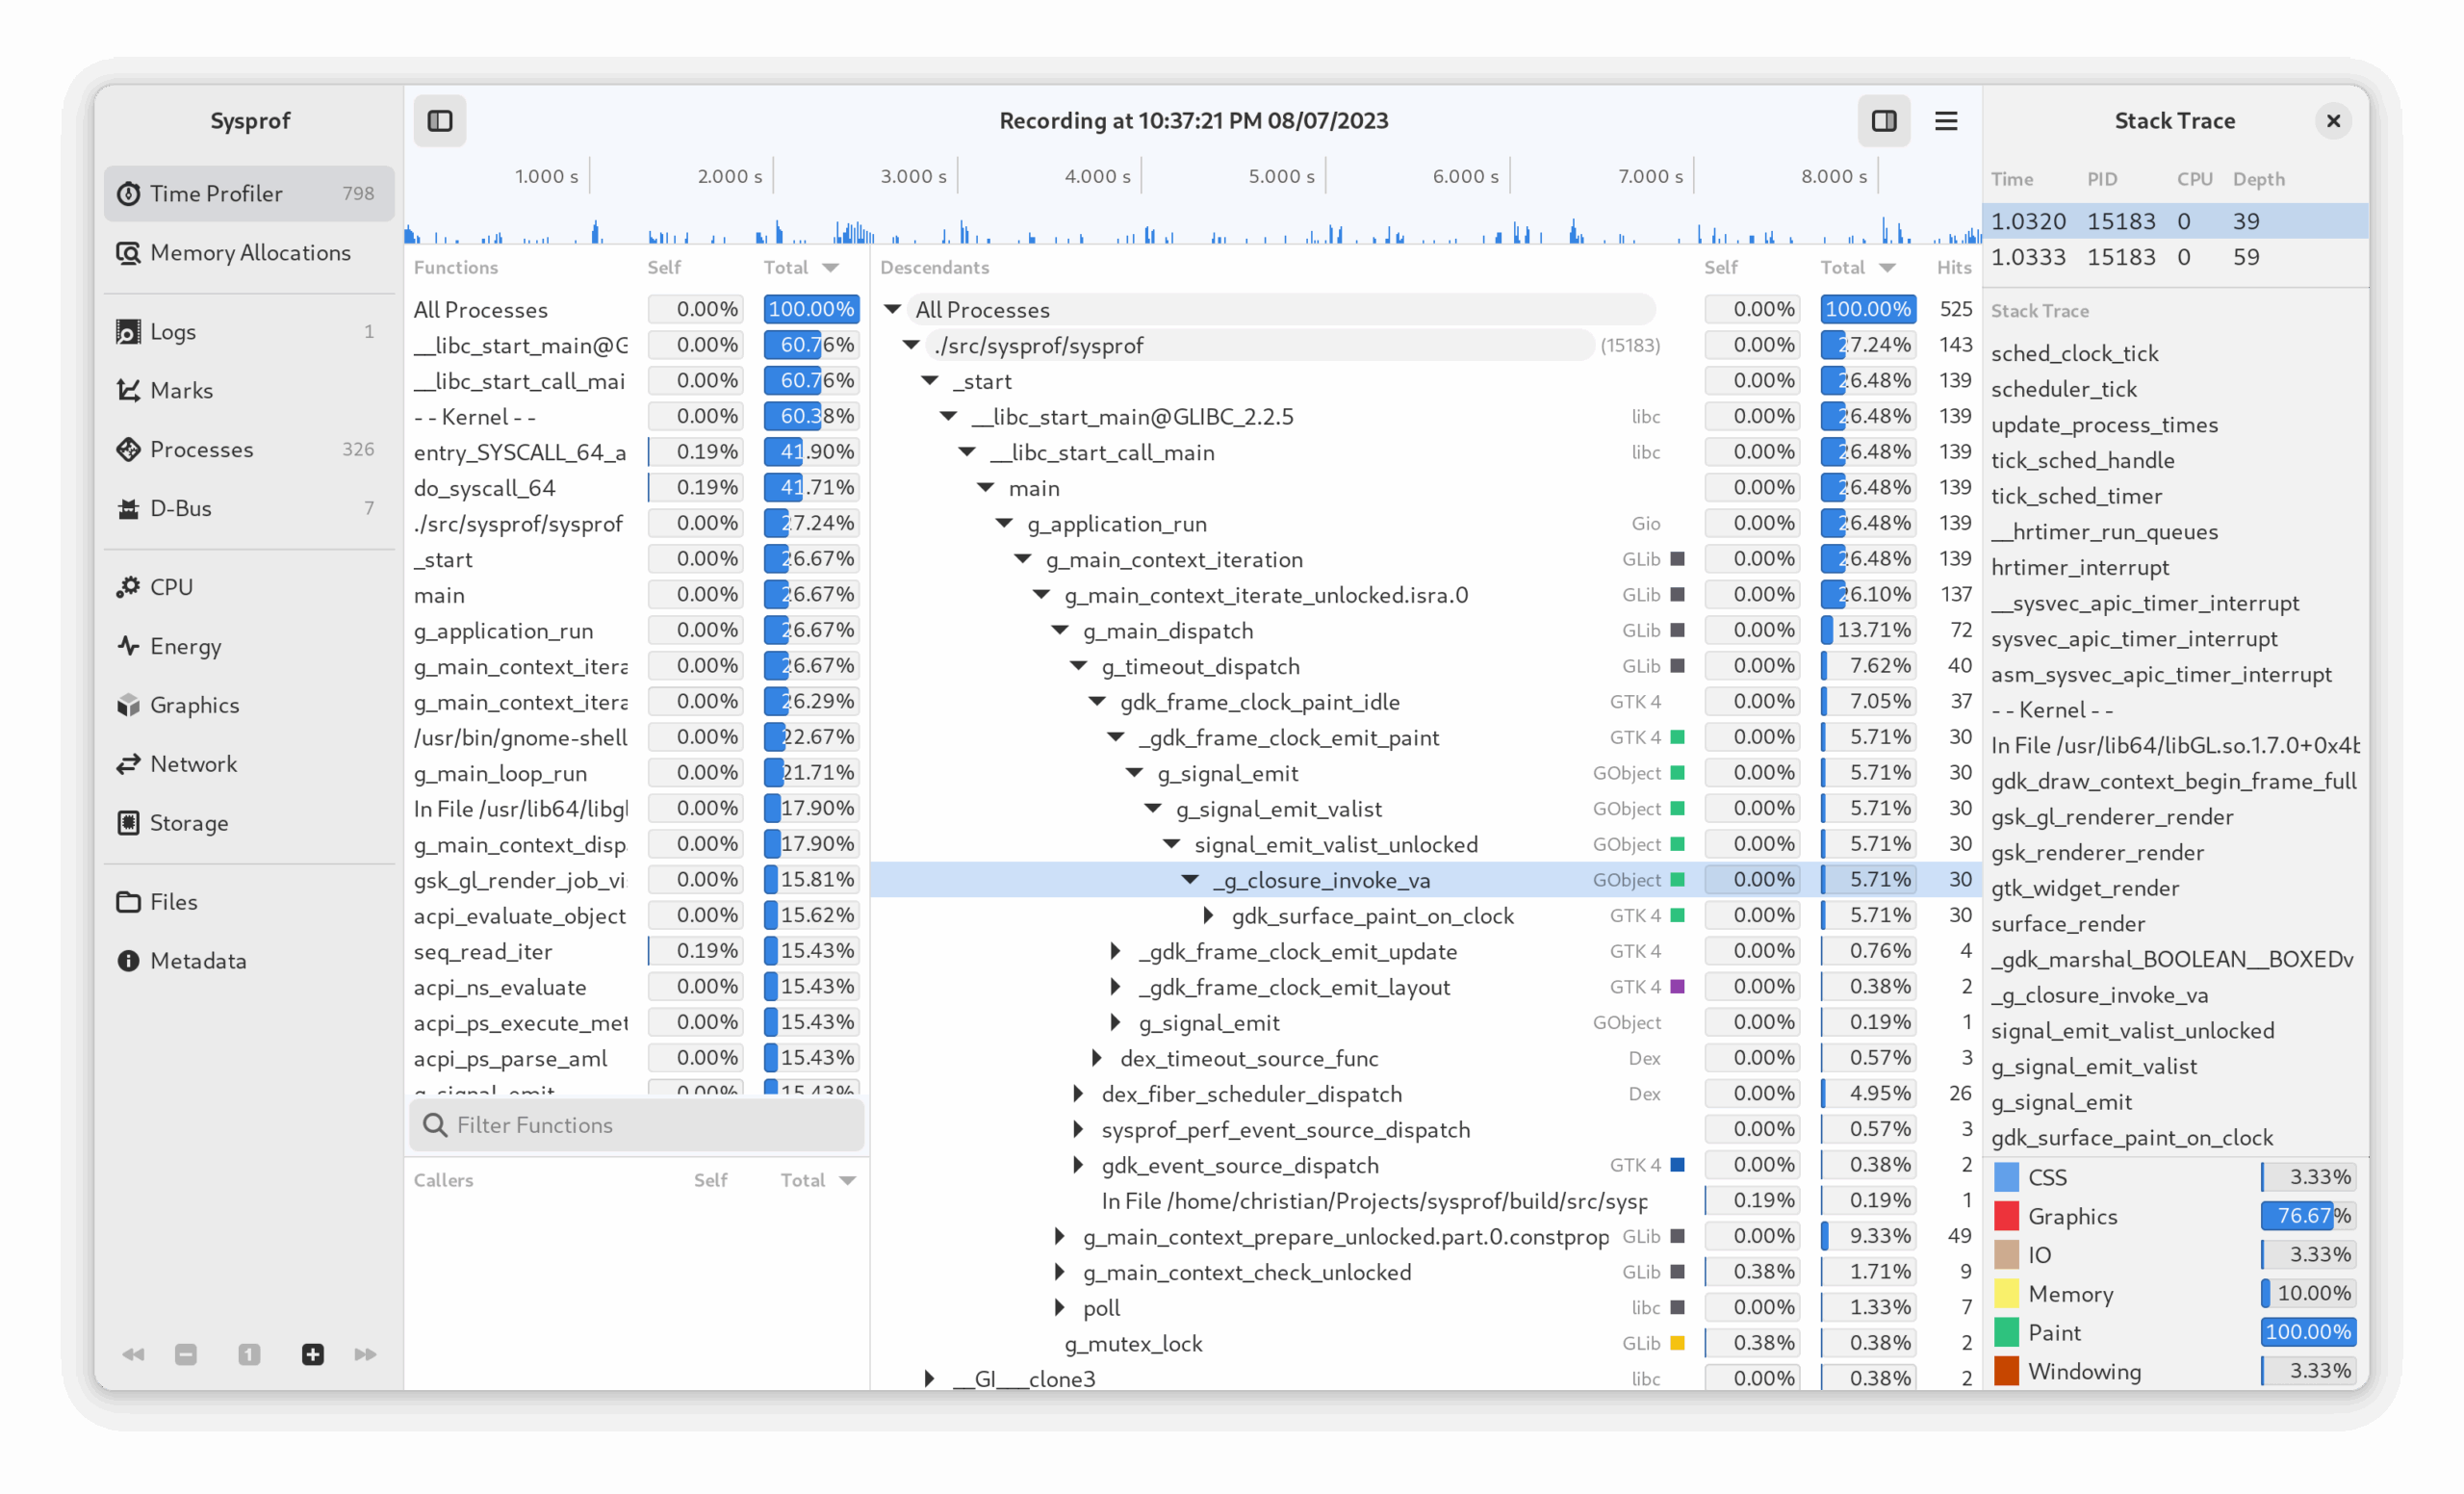
Sysprof is a sampling profiler that uses a kernel module to generate stacktraces which are then interpreted by the userspace program “sysprof”.
This is free and open source software.
Key Features
- Detailed, accurate, and fast profiling of the entire Linux system, including the kernel and all userspace applications.
- No recompiling necessary.
- Load and Save> profiles.
- Fast, no-nonsense graphical user interface.
- Command line tool included.
- Container support – Sysprof knows how to introspect into both rootless Podman and Flatpak containers. That means if you have the appropriate debug symbols installed in those containers then Sysprof will show you high-quality symbol names in call stacks.
- Callgraphs & Flamegraphs – Sysprof can show your call stacks in the form of a traditional callgraph or flamegraph. If your recording contains truncated stack traces then use the bottom-up feature to merge stack frames from the leaves.
Website: devsuite.app/sysprof
Support: GitLab Code Repository
Developer: Christian Hergert
License: GNU General Public License v3.0
Sysprof is written in C. Learn C with our recommended free books and free tutorials.
Related Software
| Debuggers | |
|---|---|
| LLDB | Next generation, high-performance debugger |
| Ghidra | Software reverse engineering framework |
| Delve | Source level debugger for the Go programming language |
| GDB | The GNU Debugger |
| Valgrind | A memory debugger and profiler |
| Radare2 | Portable reversing framework |
| BugStalker | Rust debugger |
| Xdebug | Extension for PHP to aid debugging and development |
| Seer | GUI frontend to GDB |
| iaito | Graphical interface for radare2 |
| React Native Debugger | Standalone app for debugging React Native apps |
| KDbg | Graphical user interface to GDB |
| strace | Diagnostic, debugging and instructional userspace utility |
| rr | Record-and-replay debugger |
| drgn | Programmable debugger that puts scripting at the centre |
| cgdb | Lightweight console frontend to the GNU debugger |
| PuDB | Console-based visual debugger for Python |
| nnd | Partially inspired by RemedyBG |
| bashdb | Source-code debugger for bash; follows the GDB command syntax |
| Sysprof | Profile an application or entire system |
| crash | Linux kernel crash analysis utility |
| Nemiver | Standalone graphical debugger for GNOME |
Read our verdict in the software roundup.
 Explore our comprehensive directory of recommended free and open source software. Our carefully curated collection spans every major software category. Explore our comprehensive directory of recommended free and open source software. Our carefully curated collection spans every major software category.This directory is part of our ongoing series of informative articles for Linux enthusiasts. It features hundreds of detailed reviews, along with open source alternatives to proprietary solutions from major corporations such as Google, Microsoft, Apple, Adobe, IBM, Cisco, Oracle, and Autodesk. You’ll also find interesting projects to try, hardware coverage, free programming books and tutorials, and much more. Discovered a useful open source Linux program that we haven’t covered yet? Let us know by completing this form. |
Please read our Comment Policy before commenting.