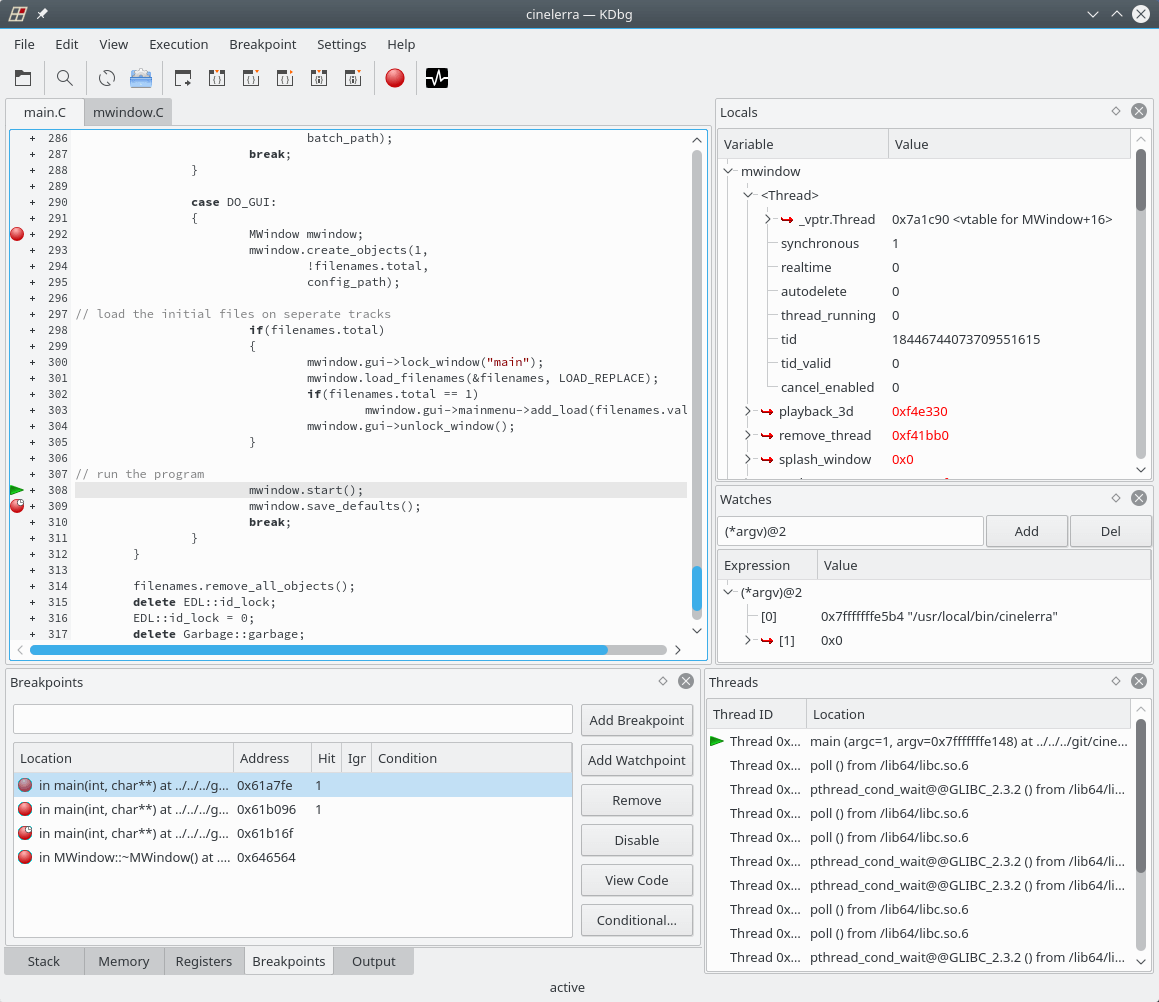
KDbg is a graphical user interface to GDB, the GNU debugger. It provides an intuitive interface for setting breakpoints, inspecting variables, and stepping through code.
KDbg requires KDE. It has been ported to KDE Framework 5.
The software is free and open source.
Key Features
- Inspection of variable values in a tree structure.
- Direct member: For certain compound data types the most important member values are displayed next to the variable name, so that it is not necessary to expand the subtree of that variable in order to see the member value. For example, you don’t need to go into a variable of type QString if you want to see the string that the variable holds. KDbg can even display Qt’s QString values, which are Unicode strings.
- Debugger at your finger tips: The basic debugger functions (step, next, run, finish, until, set/clear/enable/disable breakpoint) are bound to function keys F5 through F10. Quick and easy.
- Many other basic functions: View source code, search text, set program arguments and environment variables, display arbitrary expressions. Everything need to debug a program.
- Debugging of core dumps, attaching to running processes is possible.
- Conditional breakpoints.
Website: www.kdbg.org
Support: Manual, GitHub Code Repository
Developer: Johannes Sixt and contributors
License: GNU General Public License v2.0
KDbg is written in C++. Learn C++ with our recommended free books and free tutorials.
Related Software
| Debuggers | |
|---|---|
| LLDB | Next generation, high-performance debugger |
| Ghidra | Software reverse engineering framework |
| Delve | Source level debugger for the Go programming language |
| GDB | The GNU Debugger |
| Valgrind | A memory debugger and profiler |
| Radare2 | Portable reversing framework |
| BugStalker | Rust debugger |
| Xdebug | Extension for PHP to aid debugging and development |
| Seer | GUI frontend to GDB |
| iaito | Graphical interface for radare2 |
| React Native Debugger | Standalone app for debugging React Native apps |
| KDbg | Graphical user interface to GDB |
| strace | Diagnostic, debugging and instructional userspace utility |
| rr | Record-and-replay debugger |
| drgn | Programmable debugger that puts scripting at the centre |
| cgdb | Lightweight console frontend to the GNU debugger |
| PuDB | Console-based visual debugger for Python |
| nnd | Partially inspired by RemedyBG |
| bashdb | Source-code debugger for bash; follows the GDB command syntax |
| Sysprof | Profile an application or entire system |
| crash | Linux kernel crash analysis utility |
| Nemiver | Standalone graphical debugger for GNOME |
Read our verdict in the software roundup.
 Explore our comprehensive directory of recommended free and open source software. Our carefully curated collection spans every major software category. Explore our comprehensive directory of recommended free and open source software. Our carefully curated collection spans every major software category.This directory is part of our ongoing series of informative articles for Linux enthusiasts. It features hundreds of detailed reviews, along with open source alternatives to proprietary solutions from major corporations such as Google, Microsoft, Apple, Adobe, IBM, Cisco, Oracle, and Autodesk. You’ll also find interesting projects to try, hardware coverage, free programming books and tutorials, and much more. Discovered a useful open source Linux program that we haven’t covered yet? Let us know by completing this form. |