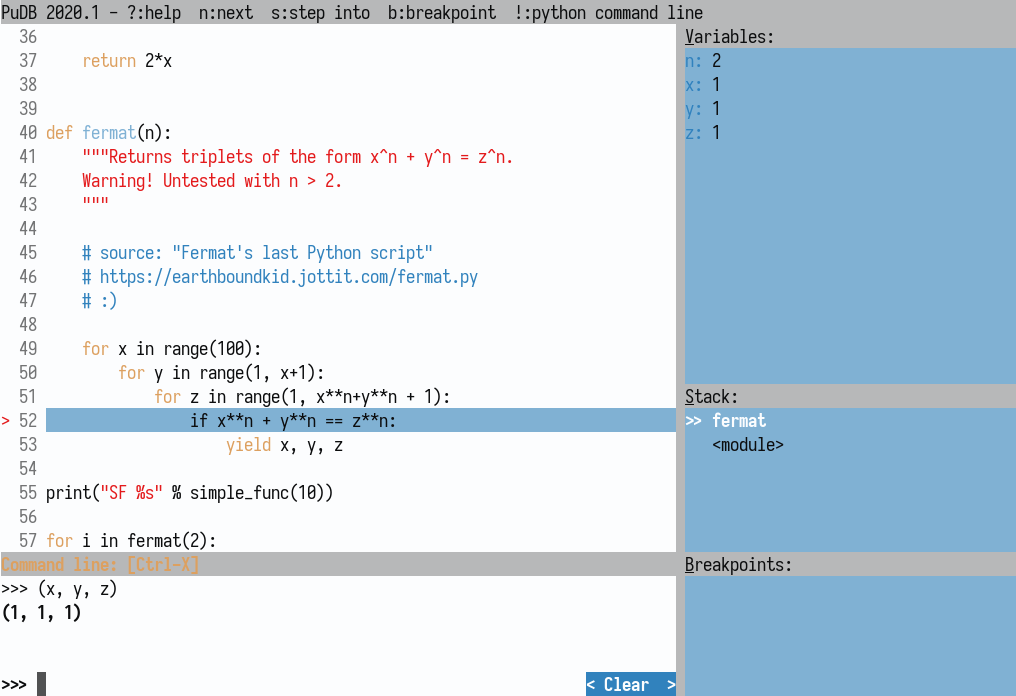
PuDB is a console-based visual debugger for Python.
Its goal is to provide all the niceties of modern GUI-based debuggers in a more lightweight and keyboard-friendly package. PuDB allows you to debug code right where you write and test it–in a terminal.
This is free and open source software.
- Syntax-highlighted source, the stack, breakpoints and variables are all visible at once and continuously updated. This helps you be more aware of what’s going on in your program. Variable displays can be expanded, collapsed and have various customization options.
- Pre-bundled themes, including dark themes via “Ctrl-P”. You can also set a custom theme.
- Simple, keyboard-based navigation using single keystrokes makes debugging quick and easy. PuDB understands cursor-keys and Vi shortcuts for navigation. Other keys are inspired by the corresponding pdb commands.
- Use search to find relevant source code, or use “m” to invoke the module browser that shows loaded modules, lets you load new ones and reload existing ones.
- Breakpoints can be set just by pointing at a source line and hitting “b” and then edited visually in the breakpoints window. Or hit “t” to run to the line under the cursor.
- Drop to a Python shell in the current environment by pressing “!”. Or open a command prompt alongside the source-code via “Ctrl-X”.
- PuDB places special emphasis on exception handling. A post-mortem mode makes it easy to retrace a crashing program’s last steps.
- Ability to control the debugger from a separate terminal.
- IPython integration.
- Compatible with Python 3.6 and newer. (Versions 2019.2 and older continue to support Python 2.7.)
Website: documen.tician.de/pudb
Support:
Developer: Andreas Klöckner and contributors
License: Apache License v2.0
PuDB is written in Python. Learn Python with our recommended free books and free tutorials.
Related Software
| Debuggers | |
|---|---|
| LLDB | Next generation, high-performance debugger |
| Ghidra | Software reverse engineering framework |
| Delve | Source level debugger for the Go programming language |
| GDB | The GNU Debugger |
| Valgrind | A memory debugger and profiler |
| Radare2 | Portable reversing framework |
| BugStalker | Rust debugger |
| Xdebug | Extension for PHP to aid debugging and development |
| Seer | GUI frontend to GDB |
| iaito | Graphical interface for radare2 |
| React Native Debugger | Standalone app for debugging React Native apps |
| KDbg | Graphical user interface to GDB |
| strace | Diagnostic, debugging and instructional userspace utility |
| rr | Record-and-replay debugger |
| drgn | Programmable debugger that puts scripting at the centre |
| cgdb | Lightweight console frontend to the GNU debugger |
| PuDB | Console-based visual debugger for Python |
| nnd | Partially inspired by RemedyBG |
| bashdb | Source-code debugger for bash; follows the GDB command syntax |
| Sysprof | Profile an application or entire system |
| crash | Linux kernel crash analysis utility |
| Nemiver | Standalone graphical debugger for GNOME |
Read our verdict in the software roundup.
 Explore our comprehensive directory of recommended free and open source software. Our carefully curated collection spans every major software category. Explore our comprehensive directory of recommended free and open source software. Our carefully curated collection spans every major software category.This directory is part of our ongoing series of informative articles for Linux enthusiasts. It features hundreds of detailed reviews, along with open source alternatives to proprietary solutions from major corporations such as Google, Microsoft, Apple, Adobe, IBM, Cisco, Oracle, and Autodesk. You’ll also find interesting projects to try, hardware coverage, free programming books and tutorials, and much more. Discovered a useful open source Linux program that we haven’t covered yet? Let us know by completing this form. |
Please read our Comment Policy before commenting.