

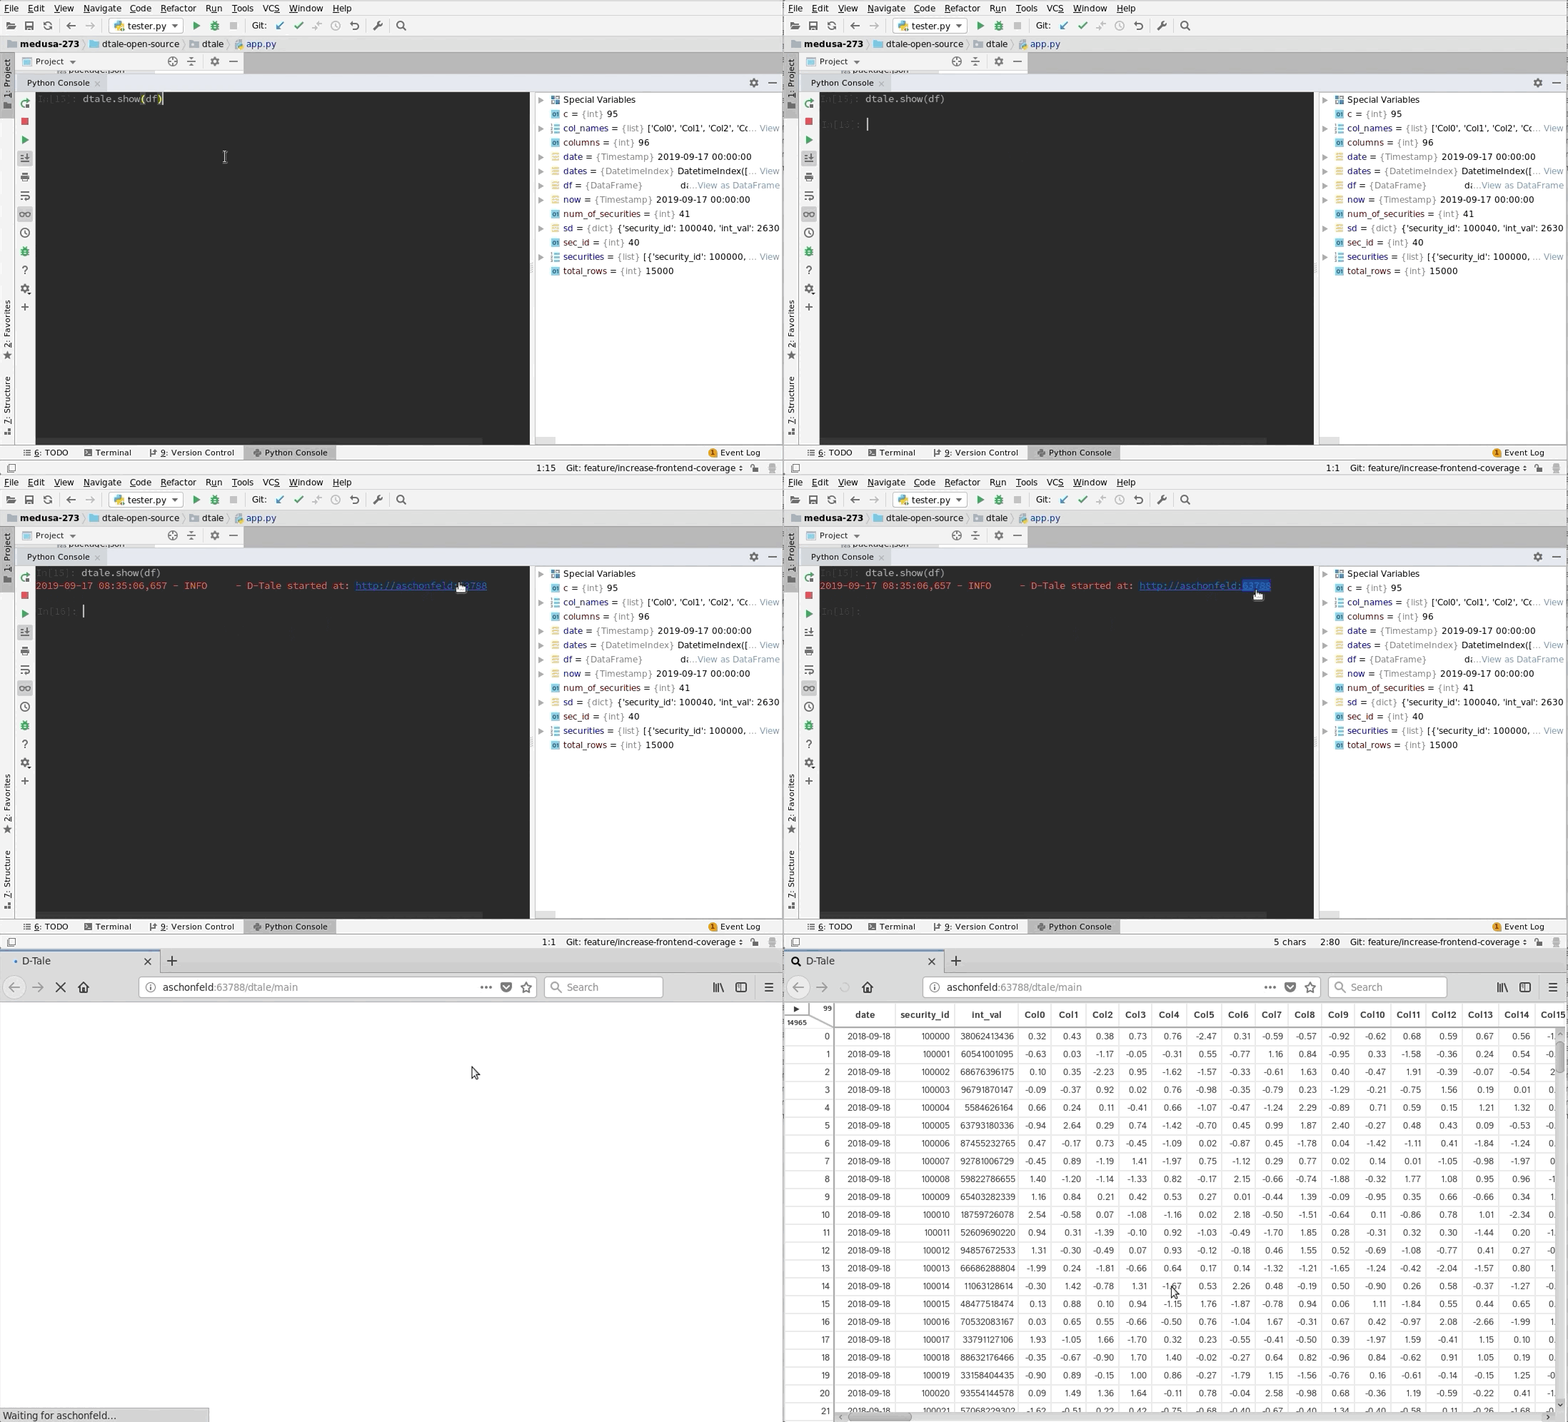
D-Tale is an interactive data exploration and visualization application that provides a graphical interface for examining pandas data structures. It allows analysts to inspect, manipulate, and visualize data through a web browser rather than relying entirely on programming commands.
The application is particularly useful during exploratory data analysis, when researchers need to examine distributions, identify missing values, investigate correlations, or understand the structure of unfamiliar datasets.
D-Tale integrates with interactive notebooks and programming environments, allowing users to move between code-driven analysis and graphical inspection while working with their data.
This is free and open source software.
Key Features
- Interactive tabular viewer for pandas DataFrames and other supported pandas data structures.
- Sort, filter, search, and rearrange columns through the graphical interface.
- Edit individual cell values and perform column operations.
- Descriptive statistical summaries of numerical and categorical data.
- Missing-value analysis identifies incomplete observations and patterns in datasets.
- Outlier detection and highlighting tools help investigate unusual values.
- Correlation analysis and heatmaps for exploring relationships between variables.
- Supports scatter plots, histograms, line charts, bar charts, and other graphical representations.
- Provides three-dimensional plots, surface charts, and network visualizations.
- DataFrame operations include merging, stacking, replacing values, and handling duplicates.
- Supports interactive filtering and data transformations without requiring manual code entry for every operation.
- Generates code representations for selected data operations.
- Exports data to CSV for use in other applications.
- Integrates with Jupyter notebooks, interactive terminals, and supported web application frameworks.
Website: github.com/man-group/dtale
Support:
Developer: Man Group and contributors
License: GNU Lesser General Public License v2.1
D-Tale is written in TypeScript and Python. Learn TypeScript with our recommended free books and free tutorials. Learn Python with our recommended free books and free tutorials.
Related Software
| Python Data Analysis | |
|---|---|
| pandas | High-level building block for doing practical, real world data analysis |
| NumPy | Core package for scientific computing with Python |
| SciPy | Ecosystem for mathematics, science, and engineering |
| Polars | DataFrame interface on top of an OLAP Query Engine |
| statsmodels | Statistical modeling and econometrics in Python |
| Dask | Advanced parallelism for analytics |
| Orange | Component-based framework for machine learning and data mining |
| Modin | Drop-in replacement for pandas |
| Vaex | Fast visualization of big data |
| AWS DW | Extends the power of pandas library |
| yt | Multi-code Toolkit for Analyzing and Visualizing Volumetric Data |
| HoloViews | Make Data Analysis and Visualization Seamless |
| datatable | Manipulate 2-dimensional tabular data structures |
| xarray | Work with labelled multi-dimensional arrays and datasets |
| pyjanitor | Extend pandas with readable data-cleaning functions |
| Optimus | Agile Data Preparation Workflows |
Read our verdict in the software roundup.
 LinuxLinks helps you discover the best free and open source software for Linux. Explore our extensive collection of recommended applications, including alternatives to popular proprietary software. We also publish software reviews, Linux tutorials, hardware reviews, free programming books and articles covering the wider open source community. Browse our Linux resources to discover more. Know a useful free and open source Linux application we haven't covered? Suggest a program for inclusion. Has your software been featured on LinuxLinks? Display one of our Featured on LinuxLinks badges on your website or GitHub README. |
Please read our Comment Policy before commenting.