

Orange is a graphical application for data mining, machine learning and interactive data visualisation. Its main attraction is a visual programming environment that allows users to construct analytical workflows without writing code.
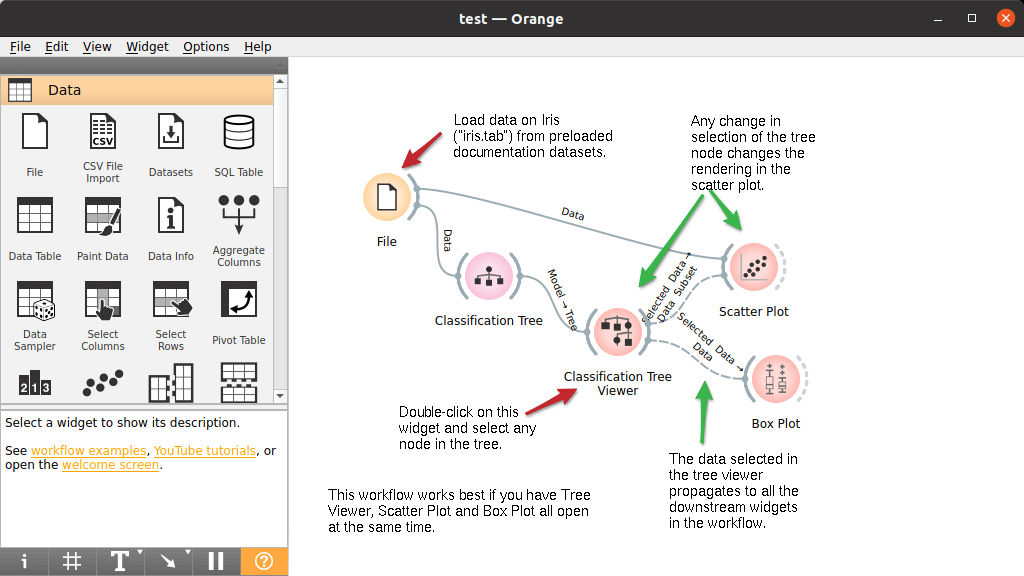
Workflows are assembled on a canvas by connecting widgets representing individual operations. A typical analysis might load a dataset, select relevant attributes, explore statistical distributions, train several predictive models and compare their performance.
Orange is particularly suited to exploratory data analysis and education. Its interactive visualisations help users investigate relationships between variables, identify unusual observations and understand how machine learning algorithms behave.
Although many tasks can be completed entirely through the graphical interface, Orange also provides facilities for more advanced analysis and custom scripting. Additional modules extend its capabilities into specialist areas, including text mining, networks and bioinformatics.
This is free and open source software.
Key Features
- Visual workflow editor with drag-and-drop widgets connected through data-processing pipelines.
- Load tabular data from files and supported databases.
- Inspect data using tables, distributions, descriptive statistics and feature summaries.
- Clean and transform datasets through imputation, scaling, discretisation and attribute selection.
- Interactive scatter plots, box plots, heatmaps and other statistical visualisations.
- Dimensionality reduction using PCA, multidimensional scaling, t-SNE and other techniques.
- Classification and regression with decision trees, random forests, support vector machines and additional learners.
- Clustering with k-means, hierarchical clustering and DBSCAN.
- Detect outliers and investigate relationships using distance matrices and correlation tools.
- Compare models using cross-validation and the Test and Score widget.
- Evaluate predictions with confusion matrices, ROC analysis and calibration plots.
- Interactive selection and highlighting of observations across connected visualisations.
- Extend analysis through add-ons covering text mining, networks, time series and bioinformatics.
- Python scripting widget for custom data transformations and analysis.
- Save and reuse workflows for teaching, research and analytical projects.
- Cross-platform support – runs on Linux, macOS, and Windows.
Website: orangedatamining.com
Support:
Developer: Bioinformatics Laboratory, University of Ljubljana
License: GNU General Public License v3.0
Orange is written in Python. Learn Python with our recommended free books and free tutorials.
Related Software
| Data Mining Software | |
|---|---|
| R | Software environment for statistical computing and graphics |
| MOA | Software environment for data stream mining |
| Orange | Component-based framework for machine learning and data mining |
| astroML | Python module for machine learning and data mining |
| ROOT | Aimed at solving the data analysis challenges of high-energy physics |
| ELKI | Data mining software framework developed for use in research and teaching |
| DataMelt | Full-featured data-analysis framework for scientists, engineers and students |
| KNIME | Konstanz Information Miner |
| Weka | Waikato Environment for Knowledge Analysis |
| RapidMiner | Knowledge discovery in databases, machine learning, and data mining |
| Rattle | Gnome cross platform GUI for Data Mining using R |
Read our verdict in the software roundup.
| Python Data Analysis | |
|---|---|
| pandas | High-level building block for doing practical, real world data analysis |
| NumPy | Core package for scientific computing with Python |
| SciPy | Ecosystem for mathematics, science, and engineering |
| Polars | DataFrame interface on top of an OLAP Query Engine |
| statsmodels | Statistical modeling and econometrics in Python |
| Dask | Advanced parallelism for analytics |
| Orange | Component-based framework for machine learning and data mining |
| Modin | Drop-in replacement for pandas |
| Vaex | Fast visualization of big data |
| AWS DW | Extends the power of pandas library |
| yt | Multi-code Toolkit for Analyzing and Visualizing Volumetric Data |
| HoloViews | Make Data Analysis and Visualization Seamless |
| datatable | Manipulate 2-dimensional tabular data structures |
| xarray | Work with labelled multi-dimensional arrays and datasets |
| pyjanitor | Extend pandas with readable data-cleaning functions |
| Optimus | Agile Data Preparation Workflows |
Read our verdict in the software roundup.
 LinuxLinks helps you discover the best free and open source software for Linux. Explore our extensive collection of recommended applications, including alternatives to popular proprietary software. We also publish software reviews, Linux tutorials, hardware reviews, free programming books and articles covering the wider open source community. Browse our Linux resources to discover more. Know a useful free and open source Linux application we haven't covered? Suggest a program for inclusion. Has your software been featured on LinuxLinks? Display one of our Featured on LinuxLinks badges on your website or GitHub README. |
Please read our Comment Policy before commenting.