
Vega-Altair is a declarative statistical visualization library for Python, based on Vega and Vega-Lite. This means you can write Python but output Vega-Lite.
Read more
Vega-Altair is a declarative statistical visualization library for Python, based on Vega and Vega-Lite. This means you can write Python but output Vega-Lite.
Read more
Diagrams lets you draw the cloud system architecture in Python code. Diagrams is free and open source software.
Read more
VisPy is a high-performance, interactive, 2D/3D data visualization open source Python library.
Read more
Seaborn is a Python visualization library. It provides a high-level interface for drawing attractive statistical graphics in an easy way without too much boilerplate code.
Read more
Bokeh is an interactive visualization library that targets modern web browsers for presentation.
Read more
matplotlib is a pure Python 2D plotting library designed to bring publication quality plotting to Python.
Read more
yt is an open-source Python package for analyzing and visualizing volumetric data. yt focuses on driving physically-meaningful inquiry.
Read more
pscircle is a different take on the venerable ps command. It visualizes Linux processes in a form of radial tree.
Read more
Dash is a Python framework for building analytical web applications. No JavaScript is required. Dash is free and open source software.
Read more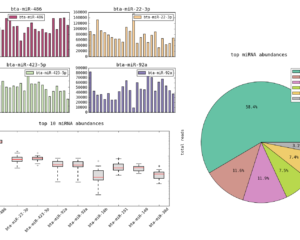
DataExplore is an open source desktop application for data analysis and plotting intended for use in both research and education. It’s targeted at non-programmers who want to perform fairly advanced table manipulation methods. It also offers fast, dynamic plot creation from selected data suitable for publication. A variety of table analysis tools are provided.
Read more