
Benchmarks
I started with KDiskMark, a free and open source graphical benchmark that uses fio underneath. Its presentation is deliberately similar to CrystalDiskMark, making the results easy to read without having to construct individual fio workloads by hand.
The main benchmarks were run on a desktop machine with an ASUS motherboard, a 13th-generation Intel processor, 64GB of RAM and an NVIDIA graphics card. Linux was installed on a separate SSD, so the G70 PRO was used purely as the test drive.
I also installed the SSD in two compact systems: the Minisforum MS-02 Ultra 285HX and Minisforum M2. The latter is powered by Intel’s Core Ultra 7 356H Panther Lake processor. Both systems can provide the G70 PRO with a PCIe 4.0 x4 connection, but their much tighter enclosures make them more interesting when looking at temperatures.
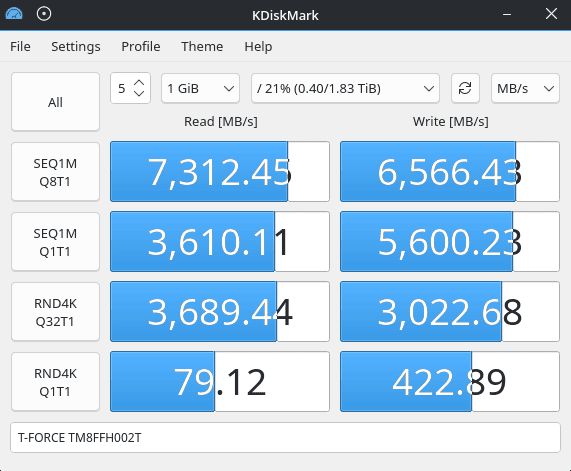
The headline KDiskMark figures are good. SEQ1M Q8T1 returned 7,312.45MB/s for reads and 6,566.43MB/s for writes. The read result is particularly close to TEAMGROUP’s quoted maximum of 7,400MB/s, while the write figure is also not far short of the advertised 6,800MB/s.
At a queue depth of one, sequential reads fell to 3,610.11MB/s while writes reached 5,600.23MB/s. That sizeable difference between the Q1T1 and Q8T1 read figures illustrates how much the drive benefits from having more I/O requests in flight.
The 4K Q32T1 test produced 3,689.44MB/s reads and 3,022.68MB/s writes. More interesting for desktop use is RND4K Q1T1, where I recorded 79.12MB/s reads and 422.89MB/s writes.
Small random reads at low queue depths don’t produce the spectacular numbers seen in SSD advertising, but they are much closer to the sort of activity generated when launching applications, accessing configuration files, loading libraries or working with source trees.
I also recorded a higher sequential-write figure in CrystalDiskMark’s SEQ1M Q8T1 test than with KDiskMark. That is not necessarily a contradiction. Although the tests use similar names and settings, the two programs do not run identical workloads. KDiskMark uses fio under Linux, whereas CrystalDiskMark uses a different Windows benchmarking implementation.
The operating system, I/O engine, caching behaviour and precise implementation of the workload can all affect the result. Matching the block size, queue depth and thread count therefore does not guarantee matching numbers.
400GiB sequential write test for probing the SLC cache
Short benchmarks are useful for showing peak performance, but they do not necessarily reveal what happens during a much longer continuous write. To investigate that, I used the following fio command:
$ fio --name=cache-fill --filename=./cache-test-file --rw=write --bs=1M --ioengine=io_uring --iodepth=32 --direct=1 --numjobs=1 --size=400G --refill_buffers --randrepeat=0 --log_avg_msec=1000 --write_bw_log=cache-fill --status-interval=1 --output=cache-fill.txt
This is a sustained sequential-write workload using 1MiB blocks, an I/O depth of 32 and a single job. --direct=1 requests direct I/O, reducing the influence of the Linux page cache.
The important difference from KDiskMark’s short sequential test is simply how much data is written. By continuing for 400GiB, the test has a much better chance of revealing what happens when the SSD’s pseudo-SLC write cache fills.
The dedicated DRAM should not be confused with this cache. The DRAM is primarily used by the controller for flash translation and mapping information. It is not acting as a hundreds-of-gigabytes write buffer. The high-speed write area comes from NAND being used in pseudo-SLC mode.
The G70 PRO performed exceptionally well here. It averaged around 6.52GiB/s across the 400GiB write, and I could not identify a sustained drop corresponding to SLC-cache exhaustion. There were small fluctuations late in the run, but throughput recovered almost immediately rather than falling permanently to a much lower level.
That does not prove the SLC cache cannot be exhausted. It means my 400GiB workload was not enough to produce an obvious cache-exhaustion point.
The difference compared with the Biwin Black Opal NV7400 was stark. In my earlier test of the 1TB Biwin, throughput remained at about 5.6GiB/s for 29 seconds before falling to roughly 640MiB/s, indicating an effective pSLC cache of around 160GiB. Its average across the complete write fell to 2,536MB/s.
The TEAMGROUP drive showed no comparable performance cliff during my test. For anyone regularly moving very large files, that result is arguably more useful than squeezing another hundred megabytes per second out of a short benchmark.
Temperature and throttling
The graphene-equipped G70 PRO stayed relatively cool in the desktop system, peaking at 56°C during the sustained-write workload despite an ambient temperature of 28.1°C.
The Minisforum M2 was a different story. In that much tighter enclosure, the SSD reached 69°C under sustained load.
That difference says as much about the host system as the SSD. A thin graphene heatspreader can help move heat away from the controller and NAND, but it still needs somewhere for that heat to go. Compact PCs with limited airflow around the M.2 slots can therefore run considerably hotter than a desktop motherboard with decent airflow.
I did not see a clear sustained collapse in write throughput corresponding to severe thermal throttling during these tests, but 69°C is close to TEAMGROUP’s specified maximum operating temperature of 70°C. I would therefore pay attention to M.2 cooling if the drive were going to see prolonged heavy writes in a mini PC.
Random access and responsiveness
Sequential transfer rates dominate SSD marketing because the numbers are impressive. They are only one part of storage performance.
A Linux desktop spends plenty of time dealing with smaller files and relatively shallow I/O queues. Application startup, shared libraries, package management, source code and configuration files are all rather different from transferring a single multi-gigabyte file at QD8.
That is why the 79.12MB/s RND4K Q1T1 read result interests me. It is modest beside the 7.3GB/s sequential figure, but low-queue-depth random access is much more relevant to how responsive a desktop SSD feels.
The sequential tests also tell an interesting story. At Q1T1, read throughput was 3,610MB/s. Raising the queue depth allowed the drive to reach 7,312MB/s. The controller and NAND can clearly take advantage of parallel I/O, but a single shallow stream does not extract all of the available bandwidth.
Real-world file transfers
Synthetic benchmarks are useful because they are controlled and repeatable. Real directory trees rarely look anything like a benchmark file.
A Linux home directory may contain large videos and virtual-machine images alongside photographs, compressed archives, source code, browser profiles and thousands of tiny configuration files. Copying that mixture introduces filesystem and metadata overhead as well as storage performance.
For that reason, I would not try to turn a KDiskMark result directly into a claimed real-world copy speed. What the benchmarks do establish is that the G70 PRO combines very high sequential throughput with good small-block performance, while the 400GiB fio run shows that its write performance remains strong over a much longer period.
That balance is more useful to me than a drive which looks spectacular for a short sequential burst but falls dramatically once its cache is exhausted.
PCIe 4.0 still makes sense
PCIe 5.0 SSDs can now comfortably exceed the sequential speeds available from a PCIe 4.0 x4 interface. Whether that matters depends on what you actually do with the drive.
The G70 PRO is already reading at more than 7.3GB/s in my KDiskMark test. A typical Linux desktop launching applications, compiling code or accessing lots of small files does not continuously demand anything close to that level of storage throughput.
PCIe 5.0 becomes much more compelling when workloads involve sustained transfers capable of exploiting that extra bandwidth. For general desktop and workstation use, I would put low-queue-depth performance, consistency and sustained write behaviour ahead of the interface generation printed on the box.
On those measures, the G70 PRO performs very well.
Pages in this article:
Page 1 – Introduction and Specifications
Page 2 – Benchmarks
Page 3 – Summary
Please read our Comment Policy before commenting.