

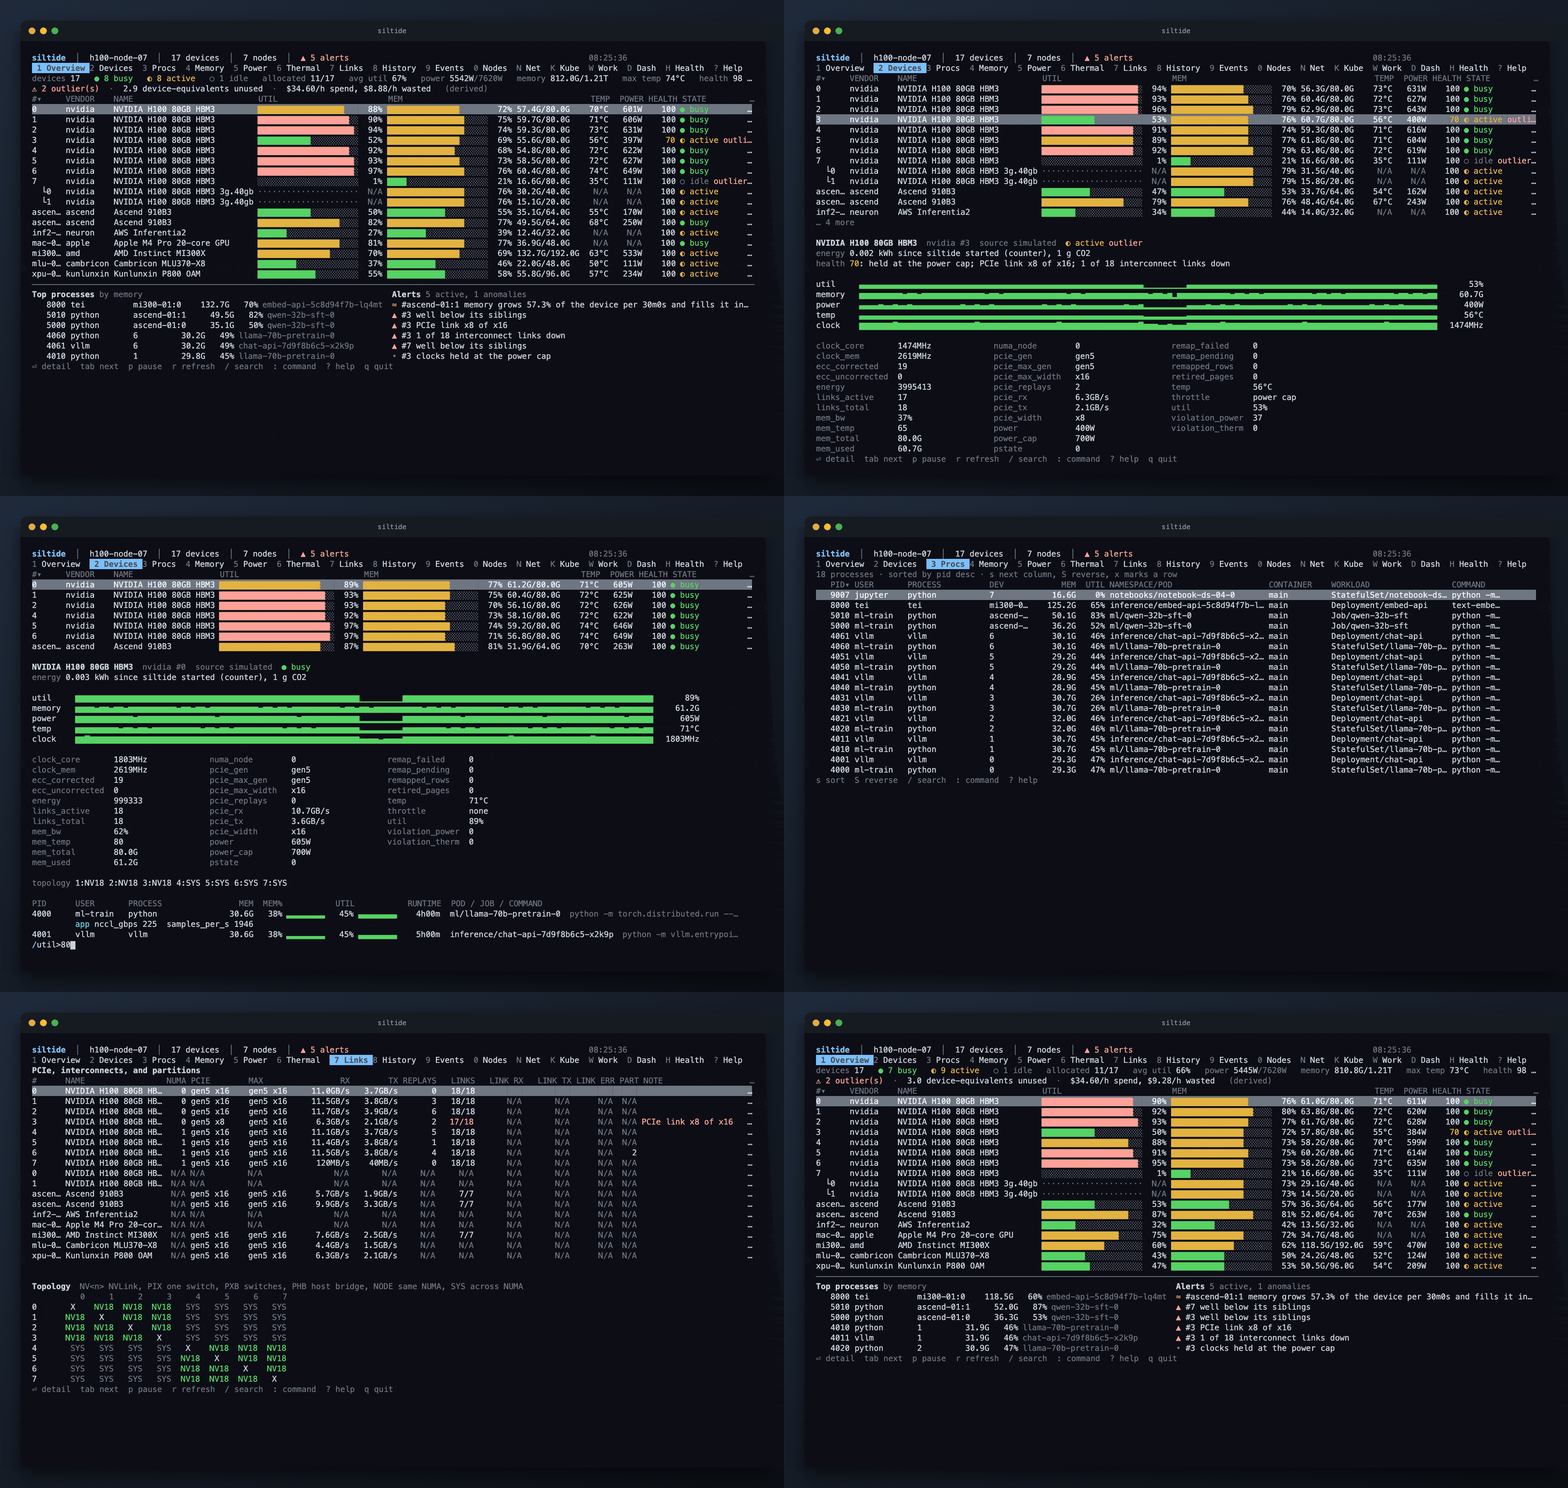
siltide is a terminal monitor built for machines and fleets that use hardware accelerators. Instead of being tied to one GPU vendor, it aims to give a common interface to GPUs, NPUs, XPUs, MLUs, DCUs and other accelerator families from a wide range of vendors.
The program is particularly suited to AI, machine learning and HPC systems where it is not enough to know that a device is busy. It brings device telemetry, workload attribution and operational health into one TUI, while also exposing machine-readable data for monitoring infrastructure and automation.
On Linux, AMD and Intel telemetry comes from kernel interfaces such as sysfs and DRM fdinfo, while NVIDIA support uses NVML. Other accelerator families use their vendor management tools. Missing values are reported as unavailable rather than guessed.
This is free and open source software.
Key Features
- Auto-detect accelerators from NVIDIA, AMD, Intel, Apple, Huawei, AWS, Cambricon, Enflame, Hygon, Iluvatar CoreX, Kunlunxin, MetaX, Moore Threads, Biren and VastAI.
- Display utilisation, memory use, processes, power, thermals, links and device health.
- Attribute accelerator use to individual processes where the underlying vendor interface provides the information.
- Show NVIDIA-specific information including MIG slices, Xid events, NVLink state, ECC data, row remapping and PCIe AER information.
- Keep monitoring history on disk for later inspection rather than limiting the interface to the current snapshot.
- Place Kubernetes pods and Slurm jobs alongside process information to make shared accelerator workloads easier to identify.
- Produce one-shot JSON output and run headlessly with an API and Prometheus metrics endpoint.
- Surface provider and parsing failures in the Health view so broken telemetry is visible to the operator.
Website: github.com/moezdil/siltide
Support:
Developer: Mesut Oezdil
License: Apache License 2.0
siltide is written in Go. Learn Go with our recommended free books and free tutorials.
Related Software
| NVIDIA GPU Monitoring Tools | |
|---|---|
| NVTOP | (h)top like task monitor for AMD, Intel and NVIDIA GPUs |
| nvitop | Bills itself as “the one-stop solution for GPU process management” |
| LACT | Configures and monitors AMD, NVIDIA and Intel GPUs |
| GPU Hot | Real-time NVIDIA GPU monitoring dashboard |
| gpustat | Query and monitor GPU status |
| GreenWithEnvy | GUI System tool |
| NVDashboard | JupyterLab extension for displaying dashboards of GPU usage |
| nv-monitor | Lightweight terminal-based monitoring application |
| nvidia-htop | Enriches the output of nvidia-smi |
| gptop | Cross-platform GPU monitor |
| NVIDIA System Monitor | Task manager monitoring your GPU |
Read our verdict in the software roundup.
 Explore our carefully curated directory of recommended free and open source software, covering every major software category. Explore our carefully curated directory of recommended free and open source software, covering every major software category.The directory forms part of our extensive collection of articles for Linux enthusiasts. It includes hundreds of detailed reviews, together with free and open source alternatives to proprietary software from companies such as Google, Microsoft, Apple, Adobe, IBM, Cisco, Oracle, and Autodesk. LinuxLinks also covers interesting projects worth exploring, Linux-compatible hardware, free programming books and tutorials, and much more. Know a useful free and open source Linux application that we haven’t covered? Tell us about it using our submission form. |
Please read our Comment Policy before commenting.