
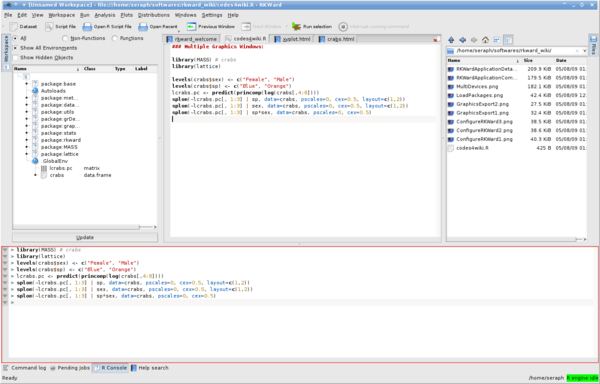
RKWard aims to become an easy to use, transparent frontend to R, a powerful system for statistical computation and graphics. This software tries to combine the power of the R-language with the ease of use of commercial statistical packages.
Besides a convenient GUI for the most important statistical functions, future versions will also provide seamless integration with an office-suite. Although it can run in numerous environments, it was designed for and integrates with the KDE desktop environment.
It aims to provide useful features both to experienced users of R, wishing to exploit R’s scripting capabilities, as well as to users new to R, looking for an easy way to carry out statistical computation tasks.
Key Features
-
- Transparent interface to the underlying R-language.
- Strives to separate content and design to a high degree.
- Relies on a language, that is not only very powerful, but also extensible, and for which dozens of extensions already exist.
- Console with syntax highlighting.
- Script editors.
- Workspace view which allows users to example and manipulate all objects in the R workspace.
- Built-in editor for data.frames.
- Analysis, including:
- Correlation.
- Crosstabs.
- Descriptive Statistics.
- Item Response Theory.
- Means.
- Miscellaneous tests.
- Moments.
- Outlier Tests.
- Regression.
- Time Series.
- Variance / Scale.
- Wilicoxon Tests.
- Plots:
- Barplot.
- Box Plot.
- Density Plot.
- Dotchart.
- ECDF Plot.
- Generic Plot.
- Histogram.
- Pareto Chart.
- Piechart.
- Scatterplot.
- Scatterplot Matrix.
- Stem-and-Leaf Plot.
- Stripchart.
- Item Response Theory.
- Distributions:
- Distribution Analysis: Anderson-Darling Normality Test, Cramer-von Mises Normality Test, Lilliefors (Kolmogorov-Smirnov) Normality Test, Pearson chi-square Normality Test, Shapiro-Francia Normality Test, Shapiro-Wilk Normality Test, Jarque-Bera Normality Test
Website: rkward.kde.org
Support: FAQ
Developer: RKWard Community
License: GNU General Public License v2.0
RKWard is written in C++. Learn C++ with our recommended free books and free tutorials.
Related Software
| Graphical User Interfaces for R | |
|---|---|
| RStudio | Professional software for R with a code editor, debugging & visualization tools |
| StatET for R | Eclipse based IDE (integrated development environment) for R |
| Rattle | R Analytic Tool To Learn Easily: Data Mining using R |
| jamovi | Provides R syntax for each analysis that is run |
| RKWard | Easy to use and easily extensible IDE/GUI |
| R Commander | A Basic-Statistics GUI for R |
| JGR | Universal and unified graphical user interface for R |
| Deducer | Intuitive, cross-platform graphical data analysis system |
Read our verdict in the software roundup.
| Graphical User Interfaces for R | |
|---|---|
| RStudio | Professional software for R with a code editor, debugging & visualization tools |
| StatET for R | Eclipse based IDE (integrated development environment) for R |
| Rattle | R Analytic Tool To Learn Easily: Data Mining using R |
| jamovi | Provides R syntax for each analysis that is run |
| RKWard | Easy to use and easily extensible IDE/GUI |
| R Commander | A Basic-Statistics GUI for R |
| JGR | Universal and unified graphical user interface for R |
| Deducer | Intuitive, cross-platform graphical data analysis system |
Read our verdict in the software roundup.
 Explore our comprehensive directory of recommended free and open source software. Our carefully curated collection spans every major software category. Explore our comprehensive directory of recommended free and open source software. Our carefully curated collection spans every major software category.This directory is part of our ongoing series of informative articles for Linux enthusiasts. It features hundreds of detailed reviews, along with open source alternatives to proprietary solutions from major corporations such as Google, Microsoft, Apple, Adobe, IBM, Cisco, Oracle, and Autodesk. You’ll also find interesting projects to try, hardware coverage, free programming books and tutorials, and much more. Discovered a useful open source Linux program that we haven’t covered yet? Let us know by completing this form. |
Please read our Comment Policy before commenting.