R is an open source programming language and software environment for statistical computing and graphics. It consists of a language together with a run-time environment with a debugger, graphics, access to system functions, and scripting.
R is an implementation of the S programming language, developed by Bell Laboratories, adding lexical scoping semantics. R offers a wide variety of statistical and graphical techniques including time series analysis, linear and nonlinear modelling, classical statistical tests, classification, clustering, and more). Combined with a large collection of intermediate tools for data analysis, good data handling and storage, general matrix calculation toolbox, R offers a coherent and well developed system which is highly extensible.
Many statisticians and data scientists use R with the command line. However, the command line can be quite daunting to a beginner of R. Fortunately, there are many different graphical user interfaces available for R which help to flatten the learning curve. We’ve restricted this group test to software that’s released under an open source license, and offers Integrated Development Environment (IDEs) facilities. Software like Jupyter Notebook and Radiant interface with R, but they are not IDEs.
Read our interactive tutorial for data science using R and RStudio. No programming knowledge required.
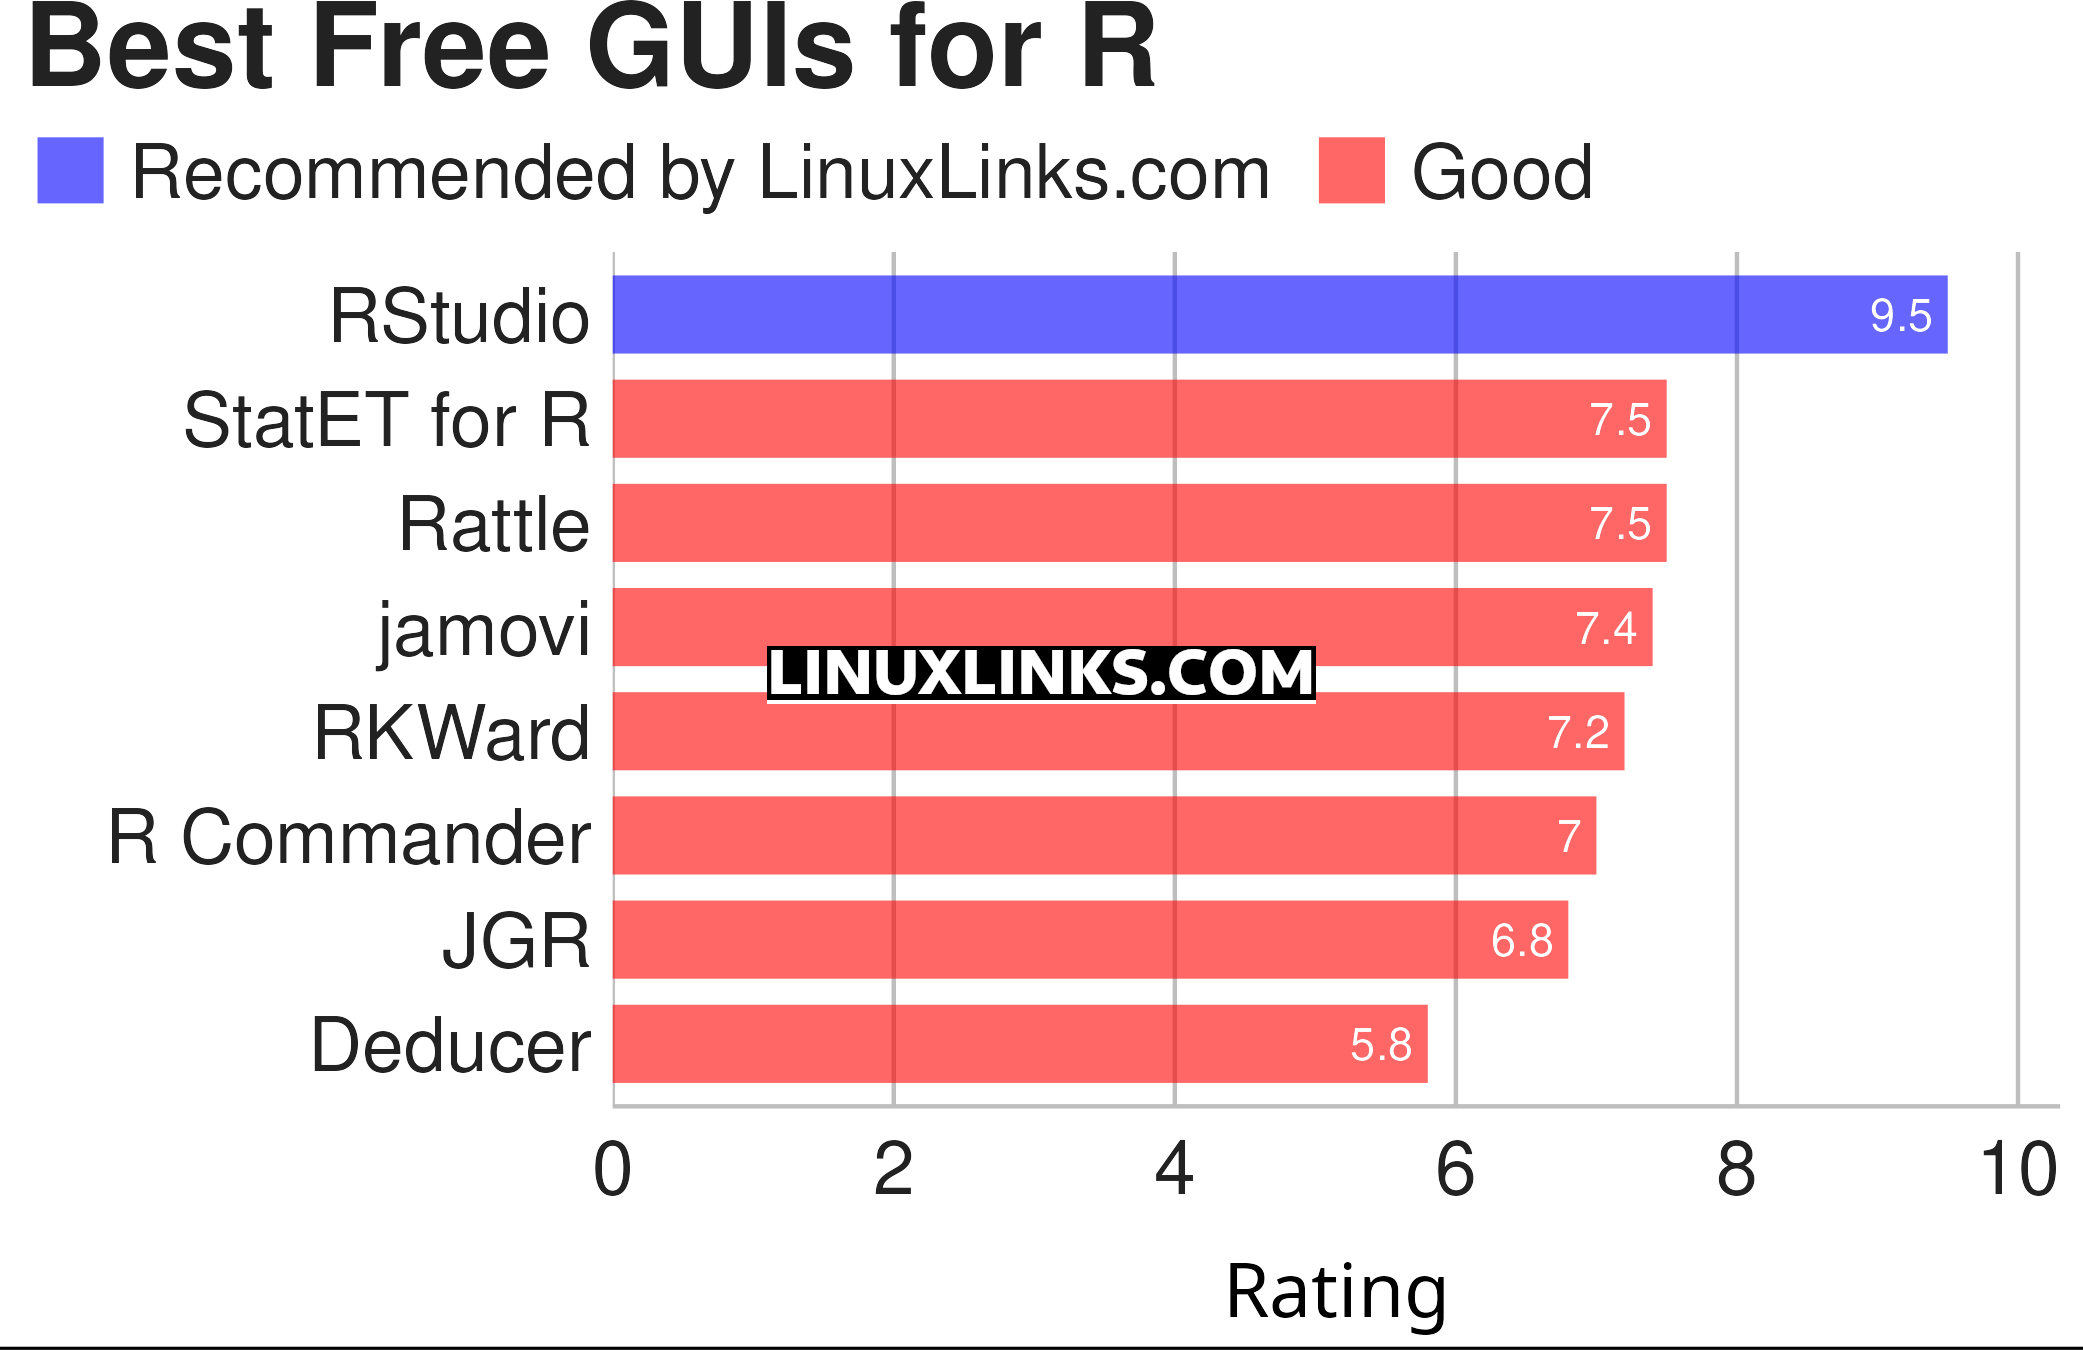
To provide an insight into the quality of software available for Linux, we have compiled a list of 8 top graphical user interfaces for R. Hopefully, there will be something of interest for anyone who wants to quickly get to grips with this programming language and environment. We give a strong recommendation to RStudio.
Here’s our verdict for each application. Only free and open source software is eligible for inclusion.

Click the links below to learn more about each program. We’ve compiled pages with full descriptions, images, and links to relevant resources for each application.
| Graphical User Interfaces for R | |
|---|---|
| RStudio | Professional software for R with a code editor, debugging & visualization tools |
| StatET for R | Eclipse based IDE (integrated development environment) for R |
| Rattle | R Analytic Tool To Learn Easily: Data Mining using R |
| jamovi | Provides R syntax for each analysis that is run |
| RKWard | Easy to use and easily extensible IDE/GUI |
| R Commander | A Basic-Statistics GUI for R |
| JGR | Universal and unified graphical user interface for R |
| Deducer | Intuitive, cross-platform graphical data analysis system |
 Read our complete collection of recommended free and open source software. Our curated compilation covers all categories of software. Read our complete collection of recommended free and open source software. Our curated compilation covers all categories of software. Spotted a useful open source Linux program not covered on our site? Please let us know by completing this form. The software collection forms part of our series of informative articles for Linux enthusiasts. There are hundreds of in-depth reviews, open source alternatives to proprietary software from large corporations like Google, Microsoft, Apple, Adobe, IBM, Cisco, Oracle, and Autodesk. There are also fun things to try, hardware, free programming books and tutorials, and much more. |
The TIOBE Programming Community index is an indicator of the popularity of programming languages. At the time of writing, R ranks 16th on that index. But this doesn’t reflect R’s popularity in data science.
Want to learn R? Check out these excellent free R books.
