Veusz (pronounced Views) is a scientific plotting and graphing program with a graphical user interface, designed to produce publication-ready 2D and 3D plots in EPS, PDF, SVG and bitmap formats. It can also be used as a module in Python for plotting.
Graphs are built-up by combining plotting widgets. The user interface aims to be simple, consistent and powerful.
Veusz provides an easy to use GUI using the Qt library. There’s also command line, scripting, DBUS and SAMP interfaces to its plotting facilities. It also allows for manipulation and editing of datasets. Data can be captured from external sources such as Internet sockets or other programs.
The software has been under development since 2005.
Key Features
- 2D plotting features:
- X-Y plots (with errorbars, colours and sizes).
- Line and function plots.
- Contour plots.
- Images (with colour mappings and colorbars).
- Stepped plots (for histograms).
- Bar graphs.
- Vector field plots.
- Box plots.
- Polar plots.
- Ternary plots.
- Plotting dates.
- Fitting functions to data.
- Stacked plots and arrays of plots.
- Nested plots.
- Plot keys.
- Plot labels.
- Shapes and arrows on plots.
- LaTeX-like text rendering.
- Multiple axes.
- Axes with steps in axis scale (broken axes).
- Axes scales using functional forms, optionally linked to another axis.
- Plotting functions of datasets.
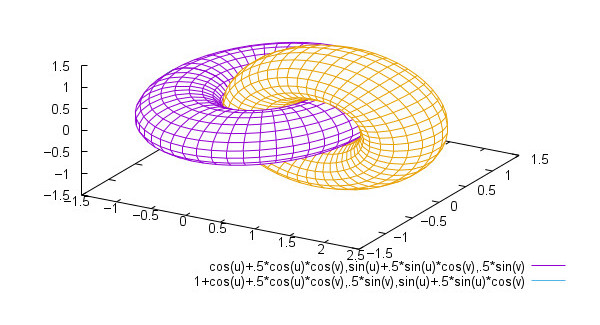
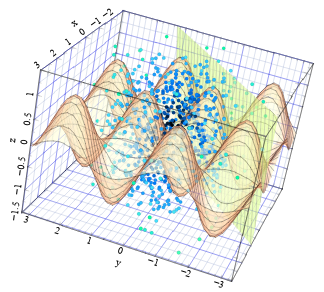
- 3D plotting features:
- 3D point plots.
- 3D surface plots from data.
- 3D function line plots.
- 3D function surface plots.
- 3D volume plots
- Multiple 3D axes.
- Multiple plots allowed in a 3D space.
- Input and output:
- EPS/PDF/PNG/SVG/EMF export.
- Dataset creation/manipulation.
- Embed Veusz within other programs
- Text, CSV, HDF5, FITS, NPY/NPZ, QDP, binary and user-plugin importing.
- Data can be captured from external sources.
- n-dimensional datasets can be sliced for plotting.
- Extending:
- Use as a Python 2/3 module.
- User defined functions, constants and can import external Python functions.
- Plugin interface to allow user to write or load code to:
- import data using new formats.
- make new datasets, optionally linked to existing datasets
- arbitrarily manipulate the document.
- Scripting interface
- Control with DBUS and SAMP.
- Other features:
- Data picker.
- Data filtering and manipulation.
- Interactive tutorial.
- Multithreaded rendering.
- Cross-platform support – runs under Linux, FreeBSD, NetBSD, OpenBSD, Mac OS X, and Windows.
Website: veusz.github.io
Support: Manual, Man page, FAQs, GitHub Code Repository
Developer: Jeremy Sanders and contributors
License: GNU General Public License v2.0
Veusz is written in Python. Learn Python with our recommended free books and free tutorials.
Related Software
| Plotting Tools | |
|---|---|
| matplotlib | Python based plotting system in a style similar to Matlab |
| ggplot2 | Powerful R package for declaratively creating graphics |
| gnuplot | Command-line driven interactive plotting program |
| ROOT | Solves the data analysis challenges of high-energy physics |
| Octave | Built-in plotting and visualization tools |
| DataMelt | Produces professional graphics with libraries for data manipulation |
| Veusz | Scientific plotting and graphing program |
| LabPlot | Data plotting and function analysis tool for KDE |
| PyQtGraph | Scientific Graphics and GUI Library for Python |
| Makie | interactive data visualizations and plotting for Julia |
| GLE | Graphics Layout Engine |
| PyVista | 3D plotting and mesh analysis |
| PLplot | Scientific plotting library |
| AlphaPlot | Fork of SciDAVis |
| SciDAVis | Scientific Data Analysis and Visualization |
| RLPlot | Generate publication quality graphs |
| Genius | Educational tool in mathematics and for research |
| ZeGrapher | 2D math and data plotter |
| Uniplot | Lightweight terminal plotting library for Python |
| Kst | Real-time large dataset viewing and plotting tool |
| Ctioga2 | Command-line plotting utility |
| Plots | Simple graph plotting app for GNOME |
| brplot | Ssmall application and library that plots data |
| SSPlot | Simple plotting utility and numerical simulator |
| Charta | Generate colorful terminal graphs |
| Incplot | Command like tool for drawing great looking plots in the terminal |
Read our verdict in the software roundup.
 Explore our comprehensive directory of recommended free and open source software. Our carefully curated collection spans every major software category. Explore our comprehensive directory of recommended free and open source software. Our carefully curated collection spans every major software category.This directory is part of our ongoing series of informative articles for Linux enthusiasts. It features hundreds of detailed reviews, along with open source alternatives to proprietary solutions from major corporations such as Google, Microsoft, Apple, Adobe, IBM, Cisco, Oracle, and Autodesk. You’ll also find interesting projects to try, hardware coverage, free programming books and tutorials, and much more. Discovered a useful open source Linux program that we haven’t covered yet? Let us know by completing this form. |