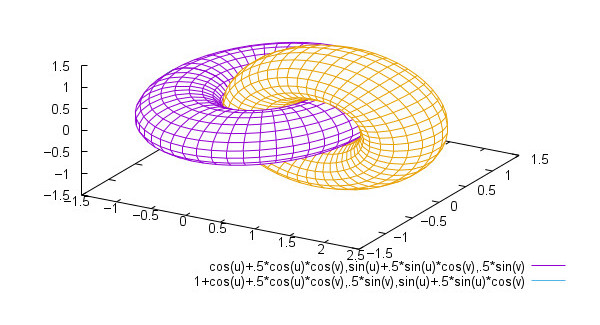
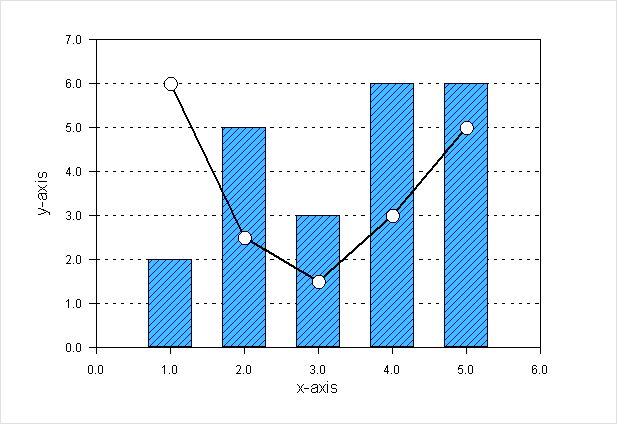
RLPlot is an open source graphical user interface based program for displaying scientific data in standard formats. It has full support for all error-bar types and it has greater flexibility with displaying colour and texture in charts than gnuplot (filled bar chart boxes are possible without any additional programs).
You may copy data from another spreadsheet program pasting them into RLPlot. It uses a common parser for spreadsheet cells, function plotting and curve fitting.
Output is generated on the X display where further changes can be made to the graph using point and click methods. Images can be exported as scalable vector graphics (SVG) as well as EPS, WMF and TIFF formats.
Key Features
- Basic statistics.
- Interactive graphical user interface.
- Vector fill patterns.
- Virtually unlimited data (hardware dependent).
- Exports SVG, EPS and several bitmap formats including PNG and JPG.
- Uses only ASCII files which may be created or modified by scripting languages.
- Uses a common parser for spreadsheet cells, function plotting and curve fitting.
- Supports a “C”-style scripting language with all elements of the scripts being inside the spreadsheet.
- Cross-platform support – available for Linux and Windows,.
Website: rlplot.sourceforge.net
Support: Documentation
Developer: Reinhard Lackner
License: GNU General Public License v2.0
Exprlp is a console application which reads RLPlot *.rlp files and converts them to other vector formats. The major objective for using exprlp is server sided scripting.
RLPlot is written in C++. Learn C++ with our recommended free books and free tutorials.
Related Software
| Plotting Tools | |
|---|---|
| matplotlib | Python based plotting system in a style similar to Matlab |
| ggplot2 | Powerful R package for declaratively creating graphics |
| gnuplot | Command-line driven interactive plotting program |
| ROOT | Solves the data analysis challenges of high-energy physics |
| Octave | Built-in plotting and visualization tools |
| DataMelt | Produces professional graphics with libraries for data manipulation |
| Veusz | Scientific plotting and graphing program |
| LabPlot | Data plotting and function analysis tool for KDE |
| PyQtGraph | Scientific Graphics and GUI Library for Python |
| Makie | interactive data visualizations and plotting for Julia |
| GLE | Graphics Layout Engine |
| PyVista | 3D plotting and mesh analysis |
| PLplot | Scientific plotting library |
| AlphaPlot | Fork of SciDAVis |
| SciDAVis | Scientific Data Analysis and Visualization |
| RLPlot | Generate publication quality graphs |
| Genius | Educational tool in mathematics and for research |
| ZeGrapher | 2D math and data plotter |
| Uniplot | Lightweight terminal plotting library for Python |
| Kst | Real-time large dataset viewing and plotting tool |
| Ctioga2 | Command-line plotting utility |
| Plots | Simple graph plotting app for GNOME |
| brplot | Ssmall application and library that plots data |
| SSPlot | Simple plotting utility and numerical simulator |
| Charta | Generate colorful terminal graphs |
| Incplot | Command like tool for drawing great looking plots in the terminal |
Read our verdict in the software roundup.
 Explore our comprehensive directory of recommended free and open source software. Our carefully curated collection spans every major software category. Explore our comprehensive directory of recommended free and open source software. Our carefully curated collection spans every major software category.This directory is part of our ongoing series of informative articles for Linux enthusiasts. It features hundreds of detailed reviews, along with open source alternatives to proprietary solutions from major corporations such as Google, Microsoft, Apple, Adobe, IBM, Cisco, Oracle, and Autodesk. You’ll also find interesting projects to try, hardware coverage, free programming books and tutorials, and much more. Discovered a useful open source Linux program that we haven’t covered yet? Let us know by completing this form. |