Last Updated on May 2, 2023
In Operation
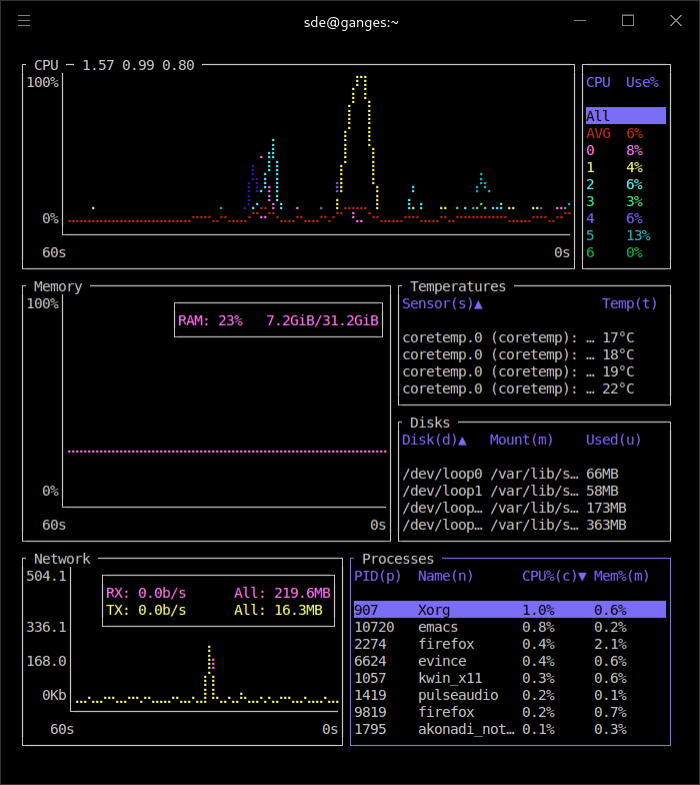
Start bottom with the btm command.
We’ve shoehorned our terminal to match the width available on our template so things look a mite squashed and some of the information is not displayed.
Let’s go through the widgets. At the top is the CPU widget showing the CPU usage across all the cores. The time range can be adjusted with a range of 30s to 600s. The box adjacent tells you we’re testing bottom on a machine with 6 cores. We can monitor individual cores by moving up and down the CPU list, or the average CPU usage.
Below the CPU widget is the Memory widget showing a visual representation of RAM. It also shows swap usage but this test system has no swap partition or file configured (32GB of RAM with no swap is sufficient for our testing purposes). Again the time range can be adjusted with a range of 30s to 600s. Adjacent are widgets reporting system temperatures and disks. The latter has more information than shown in the image above. There are columns for mount point, % used space, free space, total, amount of space, read per second, and write per second.
You’ll see that our test system is plagued by snaps being mounted and listed as block devices. The test system has an alias for df $ alias df='df -h -x squashfs -x tmpfs' which removes all that noise when using df.
The bottom widgets show network activity and a process list. The process list displays for each progress its CPU usage, memory usage, reads per second, writes per second, total read, total write, the user of the process and its state.
There is also a battery widget available which provides information about the batteries on the system: charge percent, consumption, time to empty/charge and the battery health percent. The widget supports devices with more than 1 battery.
There are lots of nice touches present. For example, pressing the e key (or starting bottom with the -e flag) expands the current widget so that it occupies the entire space. There is a basic mode ($ btm -b) which dispenses with the graphs which is useful if you prefer monitoring in a small window.
You’ll want to learn the keyboard shortcuts. Press ? to bring them up. There are general keybindings as well as specific keybindings for each widget. Below we’ve reproduced the bindings for the process widget:
dd, F9           Kill the selected process
c                Sort by CPU usage, press again to reverse
m                Sort by memory usage, press again to reverse
p                Sort by PID name, press again to reverse
n                Sort by process name, press again to reverse
Tab              Group/ungroup processes with the same name
Ctrl-F, /        Open process search widget
P                Toggle between showing the full command or just the process name
s, F6            Open process sort widget
I                Invert current sort
%                Toggle between values and percentages for memory usage
t, F5            Toggle tree mode
+, -, click      Collapse/expand a branch while in tree mode
click on header  Sorts the entries by that column, click again to invert the sort
Pages in this article:
Page 1 – Introduction / Installation
Page 2 – In Operation
Page 3 – Summary
Complete list of articles in this series:
| Essential System Tools | |
|---|---|
| Alacritty | Innovative, hardware-accelerated terminal emulator |
| BleachBit | System cleaning software. Quick and easy way to service your computer |
| bottom | Process/system monitor for the terminal |
| btop++ | Monitor usage and stats for CPU, memory, disks, network and processes |
| catfish | Versatile file searching software |
| Clonezilla | Partition and disk cloning software |
| CPU-X | System profiler with both a GUI and text-based |
| Czkawka | Find duplicate files, big files, empty files, similar images, and much more |
| ddrescue | Data recovery tool, retrieving data from failing drives as safely as possible |
| dust | More intuitive version of du written in Rust |
| f3 | Detect and fix counterfeit flash storage |
| Fail2ban | Ban hosts that cause multiple authentication errors |
| fdupes | Find or delete duplicate files |
| Firejail | Restrict the running environment of untrusted applications |
| Glances | Cross-platform system monitoring tool written in Python |
| GParted | Resize, copy, and move partitions without data |
| GreenWithEnvy | NVIDIA graphics card utility |
| gtop | System monitoring dashboard |
| gWakeOnLAN | Turn machines on through Wake On LAN |
| hyperfine | Command-line benchmarking tool |
| HyFetch | System information tool written in Python |
| inxi | Command-line system information tool that's a time-saver for everyone |
| journalctl | Query and display messages from the journal |
| kmon | Manage Linux kernel modules with this text-based tool |
| Krusader | Advanced, twin-panel (commander-style) file manager |
| Nmap | Network security tool that builds a "map" of the network |
| nmon | Systems administrator, tuner, and benchmark tool |
| nnn | Portable terminal file manager that's amazingly frugal |
| pet | Simple command-line snippet manager |
| Pingnoo | Graphical representation for traceroute and ping output |
| ps_mem | Accurate reporting of software's memory consumption |
| SMC | Multi-featured system monitor written in Python |
| Timeshift | Reliable system restore tool |
| QDirStat | Qt-based directory statistics |
| QJournalctl | Graphical User Interface for systemd’s journalctl |
| TLP | Must-have tool for anyone running Linux on a notebook |
| Unison | Console and graphical file synchronization software |
| VeraCrypt | Strong disk encryption software |
| Ventoy | Create bootable USB drive for ISO, WIM, IMG, VHD(x), EFI files |
| WTF | Personal information dashboard for your terminal |