Last Updated on May 28, 2022
In operation
Glances is a cross-platform monitoring tool which aims to present a large amount of monitoring information through a curses or Web based interface. The information dynamically adapts depending on the size of the user interface.
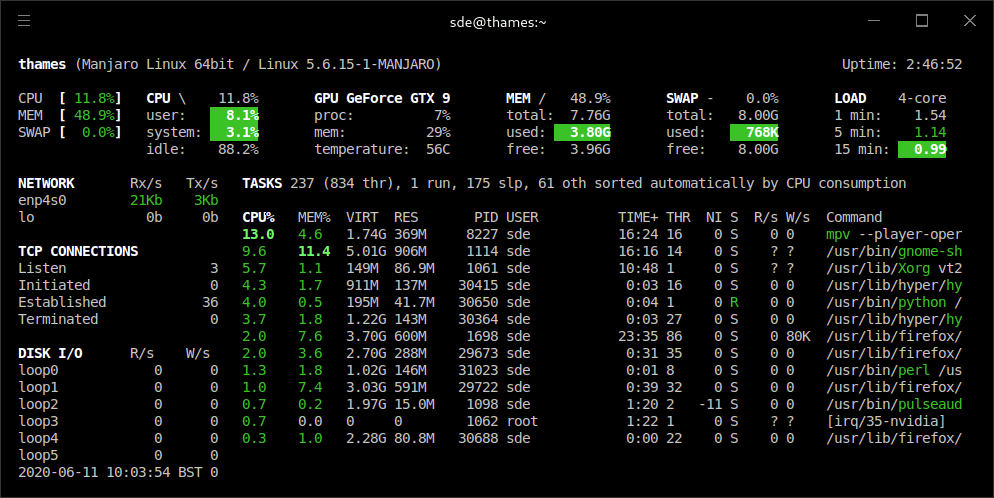
Some of the information that Glances presents isn’t displayed in the image above. For example, warning or critical alerts are not displayed. This is a consequence of Glances dynamically changing the displayed information based on the size of our Hyper terminal window.
We really like its support for monitoring remote machines via its XML-RPC server. There’s also a RESTful JDSON API.
Information displayed by Glances includes:
- CPU usage. If enough horizontal space is available, extended CPU information is displayed. In the same way as the classic top utility, pressing the 1 key shows CPU usage for each individual core.
- GPU usage (in the image above, Glances shows our test machine hosts GeForce graphics card, detailing processor usage, memory usage, and temperature.
- Memory usage. Glances uses two columns: one for the RAM and one for the SWAP.
- Load on the system.
- File system – displays the used and total file system disk space. The unit is adapted dynamically.
- Filesystem I/O – displays the disk I/O throughput. The unit is also adapted dynamically.
- Network I/O. Glances displays the network interface bit rate. The unit is again adapted dynamically (bit/s, kbit/s, Mbit/s, etc). The module also shows extended information about network connections.
- Wi-Fi – displays the Wi-Fi hotspot names and signal quality.
- Ports – provides a list of hosts/port and URL to scan.
- List of tasks.
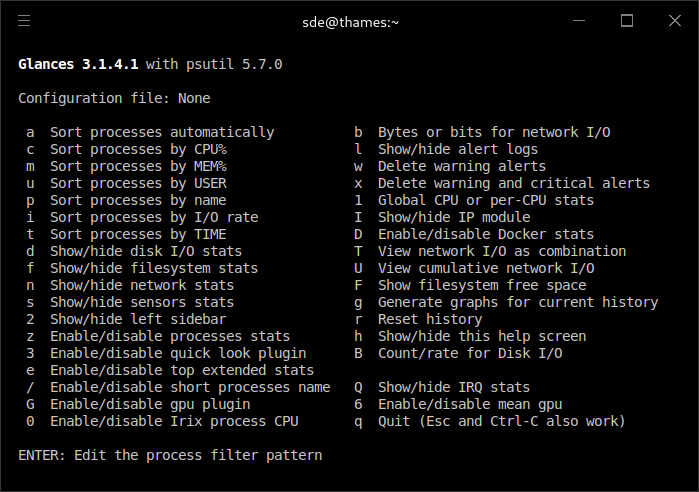
Glances lets you toggle modules on and off. With a few keyboard shortcuts you can show/hide filesystem stats, sensors stats, disk I/O stats, alert logs, and network stats. Pressing h from the Glances interface displays a complete list of the available keyboard shortcuts.
Pages in this article:
Page 1 – Introduction / Installation
Page 2 – In Operation
Page 3 – Summary
Complete list of articles in this series:
| Essential System Tools | |
|---|---|
| Alacritty | Innovative, hardware-accelerated terminal emulator |
| BleachBit | System cleaning software. Quick and easy way to service your computer |
| bottom | Process/system monitor for the terminal |
| btop++ | Monitor usage and stats for CPU, memory, disks, network and processes |
| catfish | Versatile file searching software |
| Clonezilla | Partition and disk cloning software |
| CPU-X | System profiler with both a GUI and text-based |
| Czkawka | Find duplicate files, big files, empty files, similar images, and much more |
| ddrescue | Data recovery tool, retrieving data from failing drives as safely as possible |
| dust | More intuitive version of du written in Rust |
| f3 | Detect and fix counterfeit flash storage |
| Fail2ban | Ban hosts that cause multiple authentication errors |
| fdupes | Find or delete duplicate files |
| Firejail | Restrict the running environment of untrusted applications |
| Glances | Cross-platform system monitoring tool written in Python |
| GParted | Resize, copy, and move partitions without data |
| GreenWithEnvy | NVIDIA graphics card utility |
| gtop | System monitoring dashboard |
| gWakeOnLAN | Turn machines on through Wake On LAN |
| hyperfine | Command-line benchmarking tool |
| HyFetch | System information tool written in Python |
| inxi | Command-line system information tool that's a time-saver for everyone |
| journalctl | Query and display messages from the journal |
| kmon | Manage Linux kernel modules with this text-based tool |
| Krusader | Advanced, twin-panel (commander-style) file manager |
| Nmap | Network security tool that builds a "map" of the network |
| nmon | Systems administrator, tuner, and benchmark tool |
| nnn | Portable terminal file manager that's amazingly frugal |
| pet | Simple command-line snippet manager |
| Pingnoo | Graphical representation for traceroute and ping output |
| ps_mem | Accurate reporting of software's memory consumption |
| SMC | Multi-featured system monitor written in Python |
| Timeshift | Reliable system restore tool |
| QDirStat | Qt-based directory statistics |
| QJournalctl | Graphical User Interface for systemd’s journalctl |
| TLP | Must-have tool for anyone running Linux on a notebook |
| Unison | Console and graphical file synchronization software |
| VeraCrypt | Strong disk encryption software |
| Ventoy | Create bootable USB drive for ISO, WIM, IMG, VHD(x), EFI files |
| WTF | Personal information dashboard for your terminal |