
Last Updated on August 6, 2020
In Operation
Start the software by typing vis at a shell. The only flags are -c, which lets you define the config file path, and -h which gives the briefest of help list.
The image below is the stereo mode.
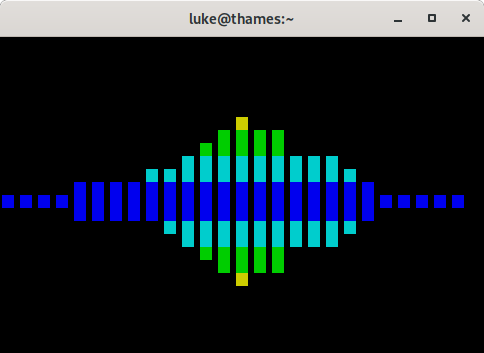
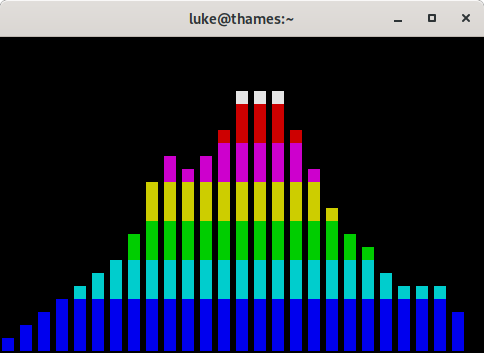
You can toggle between stereo and mono by pressing “s”. The image below is the mono mode.
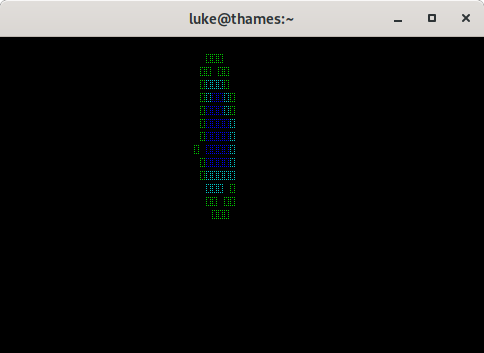
Here’s the ellipse visualizer.
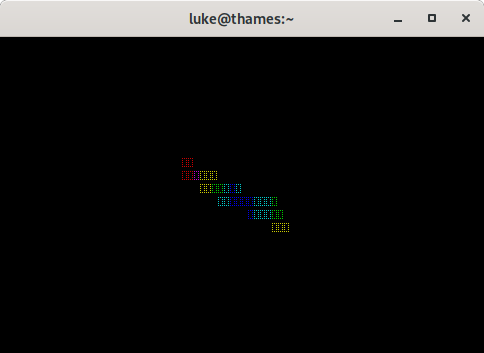
And there’s also a Lorenz visualizer. This visualizer is based on the Lorenz equations. The Lorenz system is a system of ordinary differential equations first studied by Edward Lorenz. It’s notable for having chaotic solutions for certain parameter values and initial conditions.
The Lorenz rotates on the screen based on the volume of the left and right channels. The colors are calculated by going from the two centers points to the edges of the screen.
The volume also controls how large the Lorenz grows, higher volumes generate more points and cause the Lorenz to rotate faster.
Next page: Page 3 – Other Features
Pages in this article:
Page 1 – Introduction / Installation
Page 2 – In Operation
Page 3 – Other Features
Page 4 – Summary