
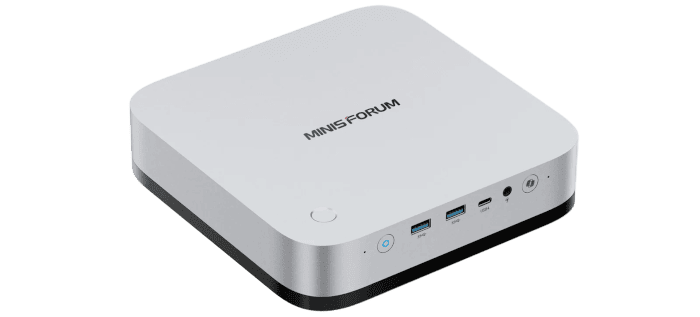
Disk
My M2 Pro review unit came with a 1TB YMTC PC411 NVMe SSD, installed in one of the machine’s PCIe 4.0 x4 slots. This is the drive used for the storage tests below.
There are two further slots available for expansion. One offers another PCIe 4.0 x4 connection, while the third is limited to PCIe 4.0 x1. The results here therefore describe the supplied SSD in its original slot, rather than the performance to expect from every possible storage configuration.
KDiskMark provides a graphical interface to the fio storage testing tool. It measures sequential and random read and write performance, giving a more useful picture than a single maximum transfer speed.
Sequential results are most relevant to moving large files, such as disk images, video files, and local AI models. Random access tests examine smaller operations scattered across the drive. Low-queue-depth random performance is particularly useful when considering everyday desktop responsiveness.
A strong sequential result doesn’t mean every file operation will run at that speed. The size and number of files, filesystem, caching, and the device at the other end of a transfer all influence what you see in practice.
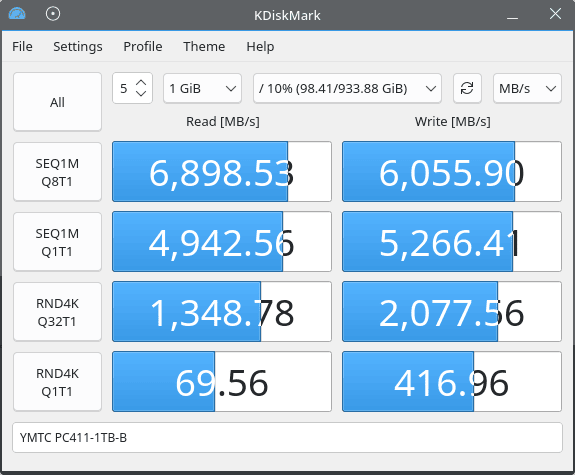
The YMTC PC411 delivers excellent sequential performance, reaching almost 6,900 MB/s for reads and just over 6,000 MB/s for writes. These are strong figures for a PCIe 4.0 SSD and should make light work of transferring large files, provided the other storage device can keep up.
Random performance is also encouraging. The 4K Q1T1 test records around 70 MB/s for reads and 417 MB/s for writes. These smaller operations are more representative of everyday desktop activity, although actual application responsiveness depends on considerably more than storage speed alone.
The Windows comparison uses CrystalDiskMark on the same SSD.
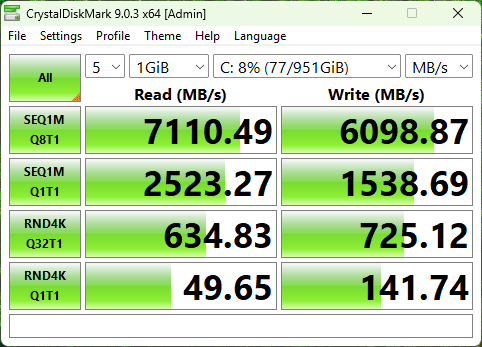
The Linux and Windows results need to be read with their test settings in mind. Differences in the filesystem, caching, and benchmark configuration can affect the numbers, so any gap cannot automatically be attributed to the operating system alone.
Summary
The M2 Pro’s CPU results are consistently close to those of the Core Ultra 7 356H, with gains of around 1% to 4% across these tests. Both Ryzen AI systems finish ahead in Smallpt, pbzip2, OpenSSL, and CoreMark, while Crafty puts the M2 Pro and the two AMD systems much closer together.
Graphics and memory are where the M2 Pro stands out. It leads every integrated graphics system in the Valley tests and tops all four memory charts. At 1080p, it delivers almost twice the frame rate of the AI X1 Pro’s Radeon 890M in Valley, making individual game testing an especially interesting next step.
I’ll next examine power consumption and noise to see what it takes to deliver that performance in everyday use.
Pages in this article:
Page 1 – Introduction / Processor
Page 2 – Graphics
Page 3 – Memory
Page 4 – Disk and Summary
Complete list of articles in this series:
| MINISFORUM M2 Pro-358H | |
|---|---|
| Introduction | Introduction to the series and interrogation of the machine |
Please read our Comment Policy before commenting.