
SAS Institute Inc. (“SAS”) is an American multinational developer of analytics software based in Cary, North Carolina. The company has around 14,000 employees.
SAS started as a project at North Carolina State University to create a statistical analysis system used mainly by agricultural departments at universities in the late 1960s.
SAS is the name of their software suite that can mine, alter, manage and retrieve data from a variety of sources and perform statistical analysis on it. It has more than 200 components covering areas including statistical analysis, econometrics and time series analysis, an interactive matrix language, data mining and much more.
![]() SAS/STAT provides tools and procedures for statistical modeling of data. It includes analysis of variance, linear regression, predictive modeling, statistical visualization techniques and a lot more.
SAS/STAT provides tools and procedures for statistical modeling of data. It includes analysis of variance, linear regression, predictive modeling, statistical visualization techniques and a lot more.
SAS/STAT is proprietary software. We recommend the best free and open source alternatives to SAS/STAT.
1. R
R is a statistical programming language that can be used for data manipulation, visualisation of data and statistical analysis. The R language consists of a set of tokens and keywords and a grammar that you can use to explore and understand data from many different sources.
The R community creates and shares a huge number of packages, including packages written by some of the finest academic researchers. New statistical methods appear in R extremely fast.
R offers a huge range of functions for every data manipulation, statistical model, or chart which is needed by the data analyst. R offers inbuilt mechanisms for organizing data, running calculations on the given information and creating graphical representations of that data sets.
R offers a far more comprehensive range of statistical analysis functions. With SAS/IML, it’s assumed that SAS/STAT or SAS/ETS procedures are used for many types of analysis. This complication is removed with R.
Learn R with our recommended free books and free tutorials.
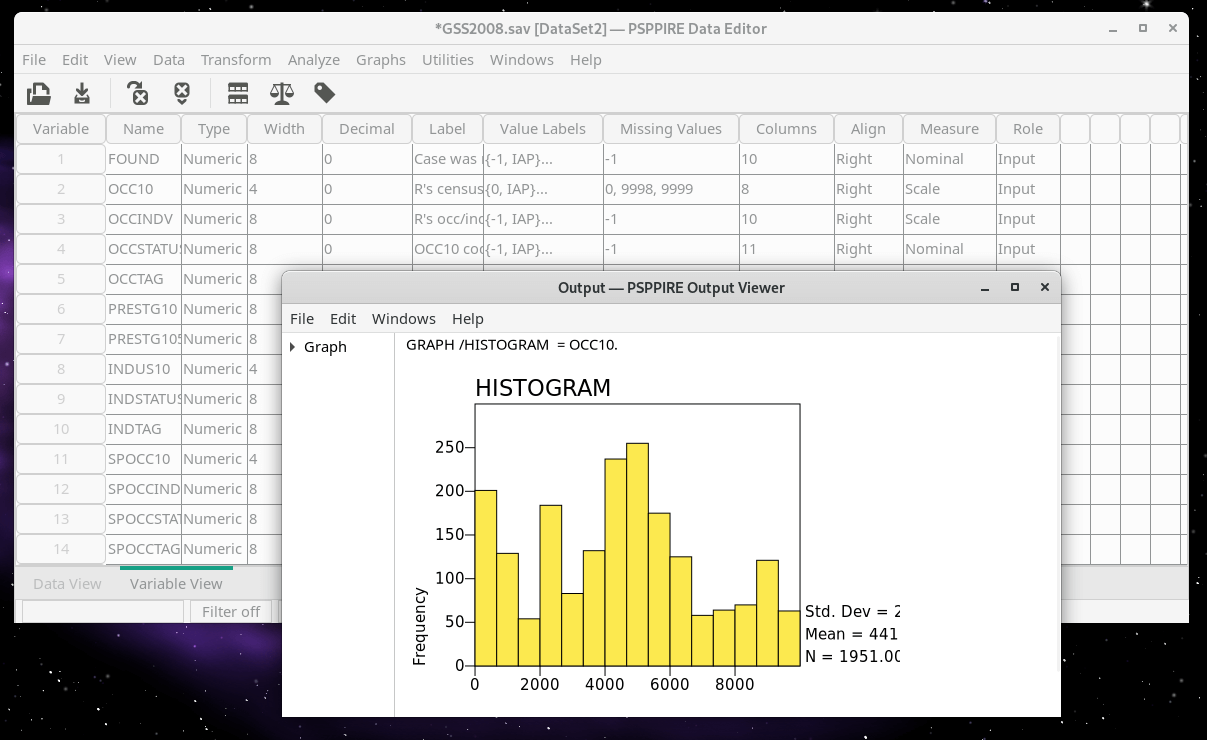
2. PSPP
PSPP is a mature and stable alternative. It can perform descriptive statistics, T-tests, anova, linear and logistic regression, measures of association, cluster analysis, reliability and factor analysis, non-parametric tests and more. Its backend is designed to perform its analyses as fast as possible, regardless of the size of the input data. You can use PSPP with its graphical interface or the more traditional syntax commands.
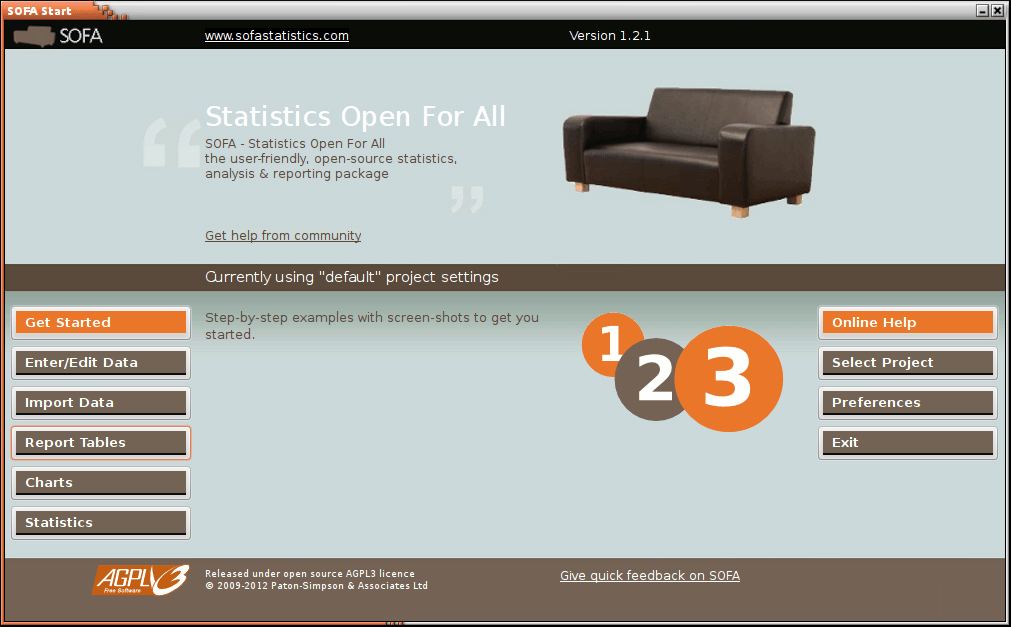
3. SOFA Statistics
SOFA Statistics is a user-friendly, statistics, analysis, and reporting package. The goal is flexible input and beautiful output – i.e. lots of databases and spreadsheets supported, and attractive, ready-to-present output.
There are many other open source software that offer good statistical analysis. For Python, we recommend SciPy, a library used for scientific computing and technical computing, and statsmodels complementing SciPy with statistical computations including descriptive statistics and estimation and inference for statistical model.
All articles in this series:
| Alternatives to SAS's Products | |
|---|---|
| Base SAS is a fourth-generation programming language (4GL) for data access, data transformation, analysis and reporting. It is included with the SAS Platform. | |
| JMP (pronounced “jump”) is a suite of computer programs for statistical analysis. JMP software combines interactive visualization with powerful statistics. | |
| SAS Enterprise BI Server provides a solid basis for vendor consolidation and BI standardization, enabling IT to focus on more effectively aligning with the business. | |
| SAS Enterprise Miner aims to streamline the data mining process. It helps you analyze complex data, discover patterns and build models so you can more easily detect fraud, anticipate resource demands and minimize customer attrition. | |
| SAS/ETS provides SAS procedures for econometric analysis, time series analysis, time series forecasting, systems modeling and simulation, time series data management, and more. | |
| SAS/GRAPH is a data visualization tool that lets you create effective, attention-grabbing graphs. It consists of a collection of procedures that let you provide a variety of charts, plots, 3-D scatter/surface plots, and more. | |
| SAS/IML is a powerful, flexible matrix programming language for interactive and exploratory data analysis. | |
| SAS/INSIGHT is a tool for data exploration and analysis. Explore data through graphs and analyses linked across multiple windows. | |
| SAS/STAT provides tools and procedures for statistical modeling of data. It includes analysis of variance, linear regression, predictive modeling, statistical visualization techniques and a lot more. |
|
Please read our Comment Policy before commenting.