
Performance: GPU
This tab offers an interactive chart for GPU usage.
It also reports the amount of video memory being used, the GPU frequency, and temperature, together with power usage.
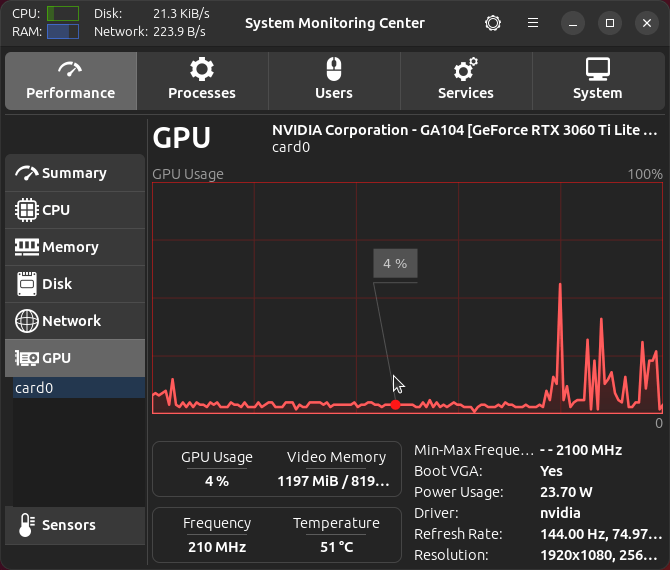
The only customization option here is to change the graph color. There’s definitely room for improvement here. For example, we’d like the ability to chart video memory usage (rather than just GPU usage). And options to set fan profiles and minimum power usage would be really useful.
We’ve previously explored a range of tools to monitor GPU usage with detailed reviews of nvitop, and GreenWithEnvy, together with a roundup of other NVIDIA GPU Monitoring Tools
Next page: Page 8 – Performance: Sensors
Pages in this article:
Page 1 – Introduction / Installation
Page 2 – Performance: Summary
Page 3 – Performance: CPU
Page 4 – Performance: Memory
Page 5 – Performance: Disk
Page 6 – Performance: Network
Page 7 – Performance: GPU
Page 8 – Performance: Sensors
Page 9 – Processes
Page 10 – Users / Services
Page 11 – System
Page 12 – Summary