
Performance: CPU
Here’s an image showing the average CPU usage.
One of the nicest features of the software is that the charts are interactive. As you can see, we have queried a specific performance data point showing 30% average CPU usage at that point in time.
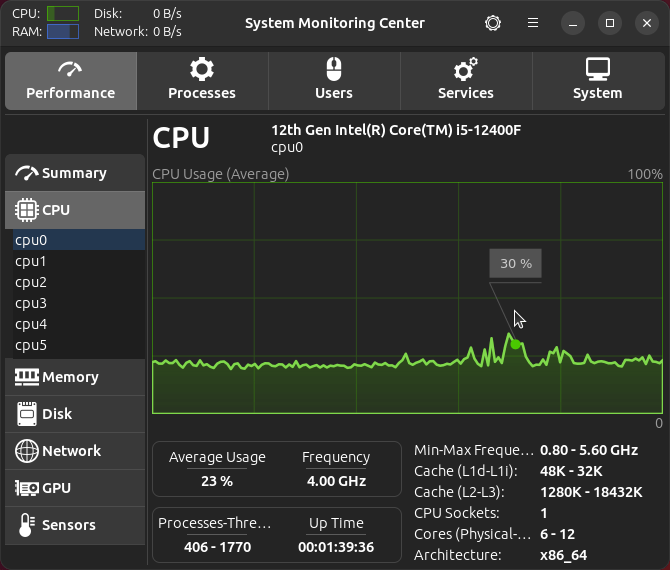
 By default, the program shows the average CPU usage.
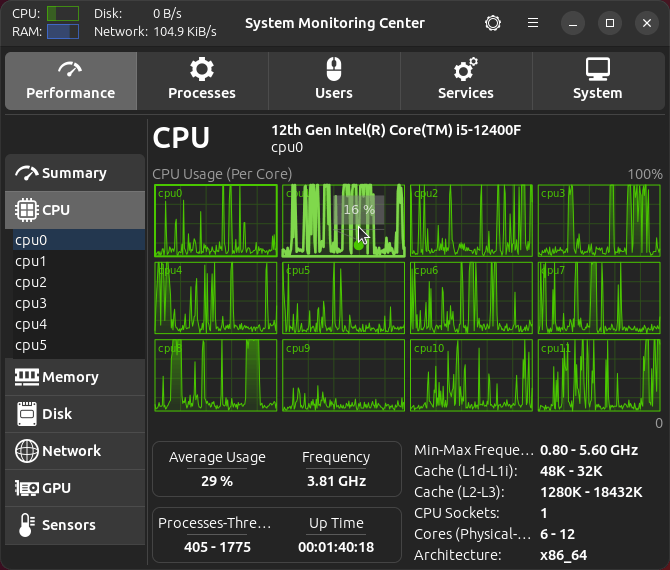
Any self-respecting monitoring program lets you monitor CPU usage per core.
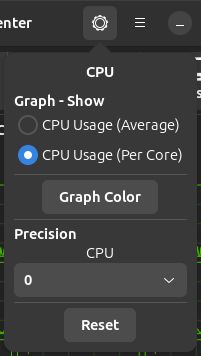
Clicking the cog icon in the top bar lets you access a customization menu for the current tab.
Here we can choose to report the average CPU usage across all cores, or to show the CPU usage per core.
There’s also the option to change the graph color and the precision of the stats.
The image below shows the utility now reporting CPU usage per core.
Next page: Page 4 – Performance: Memory
Pages in this article:
Page 1 – Introduction / Installation
Page 2 – Performance: Summary
Page 3 – Performance: CPU
Page 4 – Performance: Memory
Page 5 – Performance: Disk
Page 6 – Performance: Network
Page 7 – Performance: GPU
Page 8 – Performance: Sensors
Page 9 – Processes
Page 10 – Users / Services
Page 11 – System
Page 12 – Summary