
Performance: Memory
Here’s the memory tab. Again the chart is interactive.
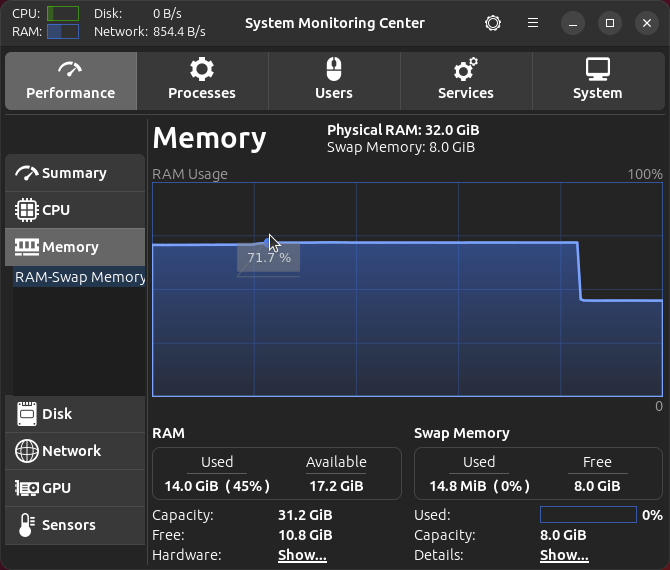
By default the chart shows a graph for RAM, but there’s a customization option to also display a chart for swap memory.
We can change the graph color, and show reported data as a power of 1024 or 1000.
Next page: Page 5 – Performance: Disk
Pages in this article:
Page 1 – Introduction / Installation
Page 2 – Performance: Summary
Page 3 – Performance: CPU
Page 4 – Performance: Memory
Page 5 – Performance: Disk
Page 6 – Performance: Network
Page 7 – Performance: GPU
Page 8 – Performance: Sensors
Page 9 – Processes
Page 10 – Users / Services
Page 11 – System
Page 12 – Summary