
In Operation
Let’s pull up an intra-day stock chart for the FTSE 100. Issue the command:
$ stonks ^FTSE -W 72
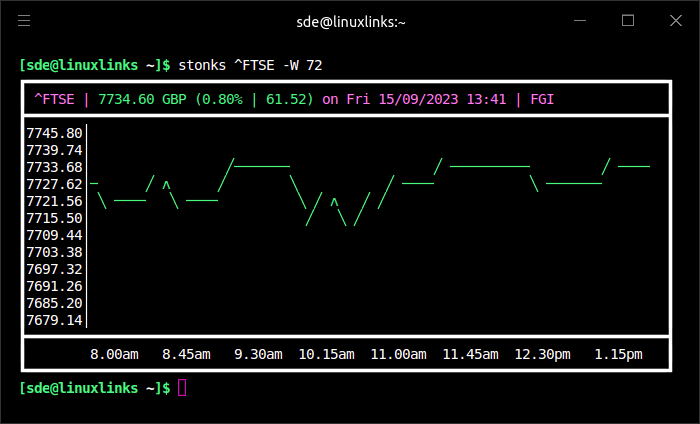
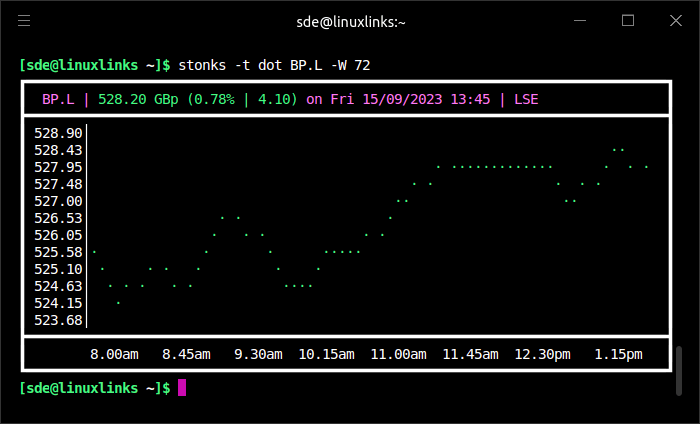
Here’s a chart of an individual stock (BP.L) listed on the London Stock Exchange.
$ stonks BP.L -W 72

Besides the line theme, we can also display charts with dot and icon themes. An example chart with the dot theme is shown below.
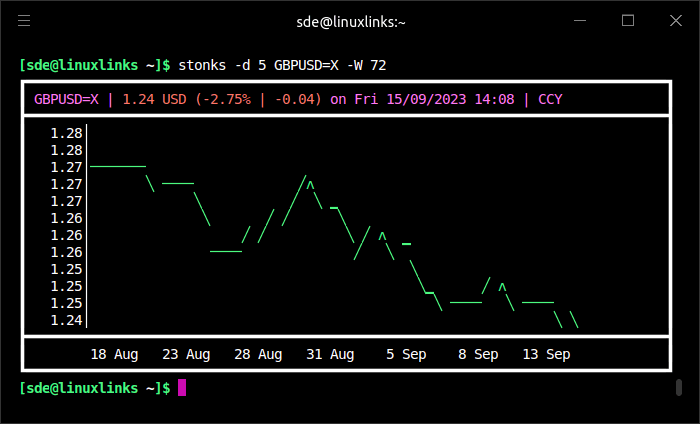
We can retrieve a stock chart over a longer period using the -d or -w options. The example below shows the exchange rate between the £ and $.
What other options are there?
-e shows extra pre + post time, -i lets you change the interval string, and we can save a string with the -s option. The latter option lets you add a favorite stock so that you can just issue the command $ stonks without needing to specify the stock.
We’ve constrained the base width of the graphs using the -W option so that each chart renders better on LinuxLinks’s website.
Summary
Stonks is a simple and lightweight command-line tool for monitoring stocks, indices, and currencies. With the help of WTF, you can even perform periodic monitoring of the financial data. WTF is a very useful dashboard tool which is highly extensible by using its wide range of modules.
Stonks lacks the flexibility of tickrs and mop, which offer useful functionality such as the grouping of stocks and an in realtime expression-based filtering engine .
Website: github.com/ericm/stonks
Support:
Developer: Eric Moynihan
License: GNU General Public License v3.0
Stonks is written in Go. Learn Go with our recommended free books and free tutorials.
Pages in this article:
Page 1 – Introduction and Installation
Page 2 – In Operation and Summary
Related Software
| Stock Tickers | |
|---|---|
| ticker | Another command-line tool written in Go |
| tickrs | Command-line tool that's written Rust |
| mop | This is billed as a stock market tracker for hackers |
| JStock | Track your stock investments |
| Stonks | Go-based terminal based stock visualizer and tracker |
| Merkato | Financial markets tracker for stocks, currencies, and cryptocurrencies |
| stocksTUI | Check stock prices, crypto, news, and historical charts |
| tstock | Python-based tool which generates stock charts in the terminal |
| Quoter | Small command-line tool to fetch stock prices |
| terminal-stocks | Query stock data directly from your shell with simple requests |
| InfoDash | Displays RSS feeds, weather and stock information |
Read our verdict in the software roundup.
 Explore our comprehensive directory of recommended free and open source software. Our carefully curated collection spans every major software category. Explore our comprehensive directory of recommended free and open source software. Our carefully curated collection spans every major software category.This directory is part of our ongoing series of informative articles for Linux enthusiasts. It features hundreds of detailed reviews, along with open source alternatives to proprietary solutions from major corporations such as Google, Microsoft, Apple, Adobe, IBM, Cisco, Oracle, and Autodesk. You’ll also find interesting projects to try, hardware coverage, free programming books and tutorials, and much more. Discovered a useful open source Linux program that we haven’t covered yet? Let us know by completing this form. |